Trends in Beverage Milk Consumption
TOPICS
USDA
photo credit: USDA
John Newton, Ph.D.
Vice President of Public Policy and Economic Analysis
The Healthy, Hunger-Free Kids Act of 2010 signed by President Obama in late 2010 reauthorized funding for school lunch programs. A key piece of the legislation that has churned the dairy industry ever since was the limitation on milk served to nonfat white and flavored milk or 1 percent white milk. By 2012, low-fat flavored milk was no longer an option in the school meal programs.
Recent legislation and an interim final rule seek to reverse this trend by allowing schools to offer low-fat flavored milk, in addition to the current offering of fat-free flavored milk, to participants in the federal school lunch and breakfast programs through the 2018-2019 school year. Today’s article reviews trends in fluid milk sales and considers the on-farm financial implications associated with higher fluid milk consumption.
Trends in Beverage Milk Consumption
Prior to the 1980s, more than 50 percent of the milk regulated by USDA’s Federal Milk Marketing Order program was in beverage milk production. By 2015, only 33 percent of milk in the Federal Order program was in fluid milk. During this time, per-capita consumption of beverage milk declined by 25 percent to approximately 18 gallons per person. Milk price volatility, the proliferation of imitation “milk” and bottled water products, reduced consumption of ready-to-eat cereals, and legislation limiting school milk options all contributed to the decline in milk sales.
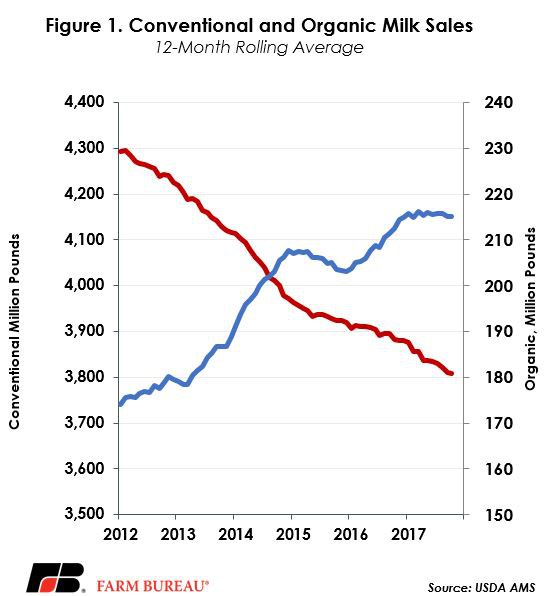
In recent years the annual decline in the market size of ready-to-eat cereals has been -3.3 percent per year – reducing the demand for fluid milk. Anecdotal evidence also suggests that almond- and coconut-based beverage sales have experienced compound annual growth rates of 66 percent and 111 percent, respectively. So, it follows that from 2012 to 2016, annual conventional milk sales declined by more than 4 billion pounds, or approximately 8 percent¸ as USDA Agricultural Marketing Service data indicates. Organic sales captured some of this market, increasing by 20 percent, or 425 million pounds, Figure 1.
Using average milk prices from the Bureau of Labor Statistics of $3.45 per gallon, the decline in milk sales represents an annual decline in fluid milk sales of $1.7 billion. Based on USDA’s farmers’ share of the food dollar estimates, the decline in fluid milk sales represents $884 million per year in farm-level dairy cash receipts – and has resulted in lower U.S. average milk prices.
The decline in conventional milk consumption was the largest in reduced-fat non-flavored milk such as 2 percent, 1 percent and skim. From 2012 to 2016, skim milk sales have declined 2.6 billion pounds, or 36 percent; 2 percent milk sales declined by 2.3 billion pounds, or 13 percent; and 1 percent milk sales declined by 411 million pounds, or 6 percent, Figure 2. Sales of flavored reduced-fat milk, including fat-free flavored milk, are in line with 2012 levels but have rebounded from the 2015 lows.
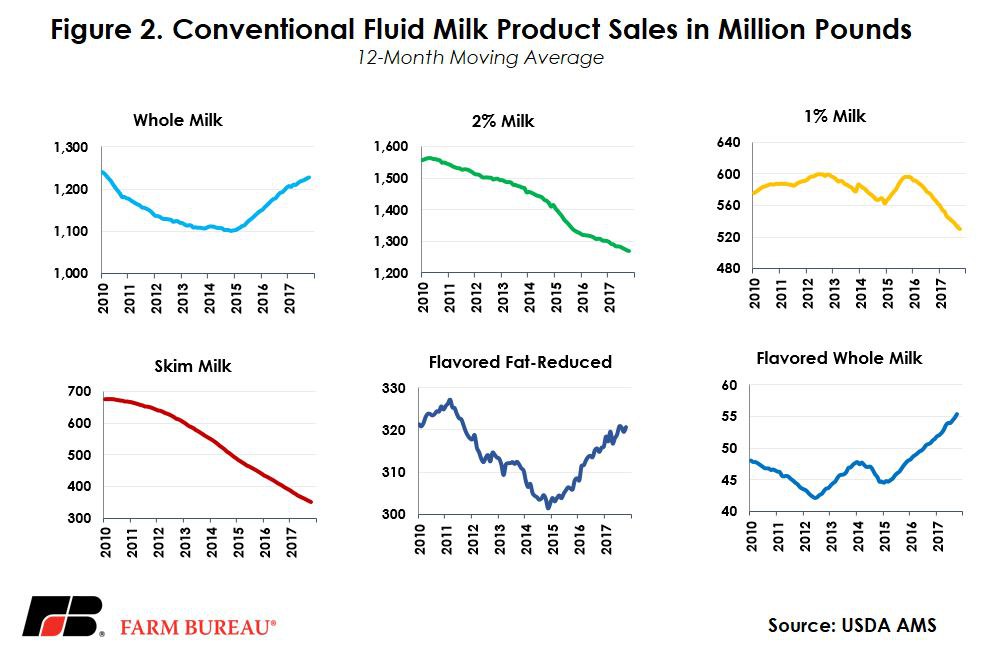
Coinciding with shifting consumer preferences to full-fat dairy products, sales of full-fat flavored and whole milk are up 1.1 billion pounds from 2012 to 2016. Whole milk sales are up nearly 1 billion pounds per year, or approximately 7 percent, and flavored whole milk sales are up 93 million pounds, or 18 percent. USDA’s Estimated Fluid Milk Products Sales Report reveals these trends are continuing in 2017. Year-to-date sales of whole milk are up 2.4 percent, flavored whole milk sales are up 9.2 percent, and reduced fat flavored milk sales are up 1.6 percent. Organic sales have remained mostly flat in 2017. Meanwhile, sales of reduced-fat non-flavored milk are all down over prior year levels.
Implications
Allowing reduced fat flavored milk in schools recognizes shifting consumer preferences for milk, and represents an opportunity to drive additional consumption. In 2016, reduced fat flavored milk represented less than 10 percent of the conventional milk market. Non-flavored reduced fat and fat-free milk represented nearly 60 percent of the conventional market so the upside potential is limited.
Milk is the number one source of nine essential nutrients in many young Americans’ diets and provides many significant health benefits. To the extent that additional reduced fat flavored milk sales to schools increase fluid milk consumption, dairy farm incomes could also see a marginal boost. Efforts to expand access to full-fat milk products would also lift fluid milk consumption and enhance dairy farmer income.
As evidenced, trends in non-flavored reduced-fat milk such as 2 percent, 1 percent and skim indicate that these products continue to face longer-term challenges. Today’s consumer obtains breakfast items on the go, reducing the consumption of ready-to-eat cereals, and are increasingly turning to alternative plant-based beverages. As these consumption trends continue to grow, innovation in the dairy case is needed to get dairy products in the hands of the on-the-go consumer and recapture lost market share. A recent Market Intel reviewed potential changes to milk prices that would reduce pricing volatility and improve risk management ultimately assisting in dairy product innovation, Proposed Changes to Fluid Milk Pricing.
Follow Market Intel on twitter @FBMarketIntel
Top Issues
VIEW ALL