2021 Disaster Estimations Reveal at Least $12.5 Billion in Crop and Forage Losses
TOPICS
Wildfires
photo credit: Montana Farm Bureau, Used with Permission
Daniel Munch
Economist
AFBF’s Market Intel team has created a multi-part series highlighting agricultural losses incurred due to weather disasters and the associated disaster assistance programs meant to help mitigate their impacts. Previous articles include: 2020 Disaster Estimations Reveal at Least $3.6 Billion in Uncovered Losses, 2020 Disasters Reveal Gaps in Ad Hoc Aid Legislation, Continuing Resolution Extends Disaster Coverage for Most 2020 and 2021 Losses and Kentucky Arkansas Tornadoes, Midwest Derecho Renew Calls for Timely Disaster Assistance. This Market Intel article updates and summarizes total crop loss estimations across weather events for 2021.
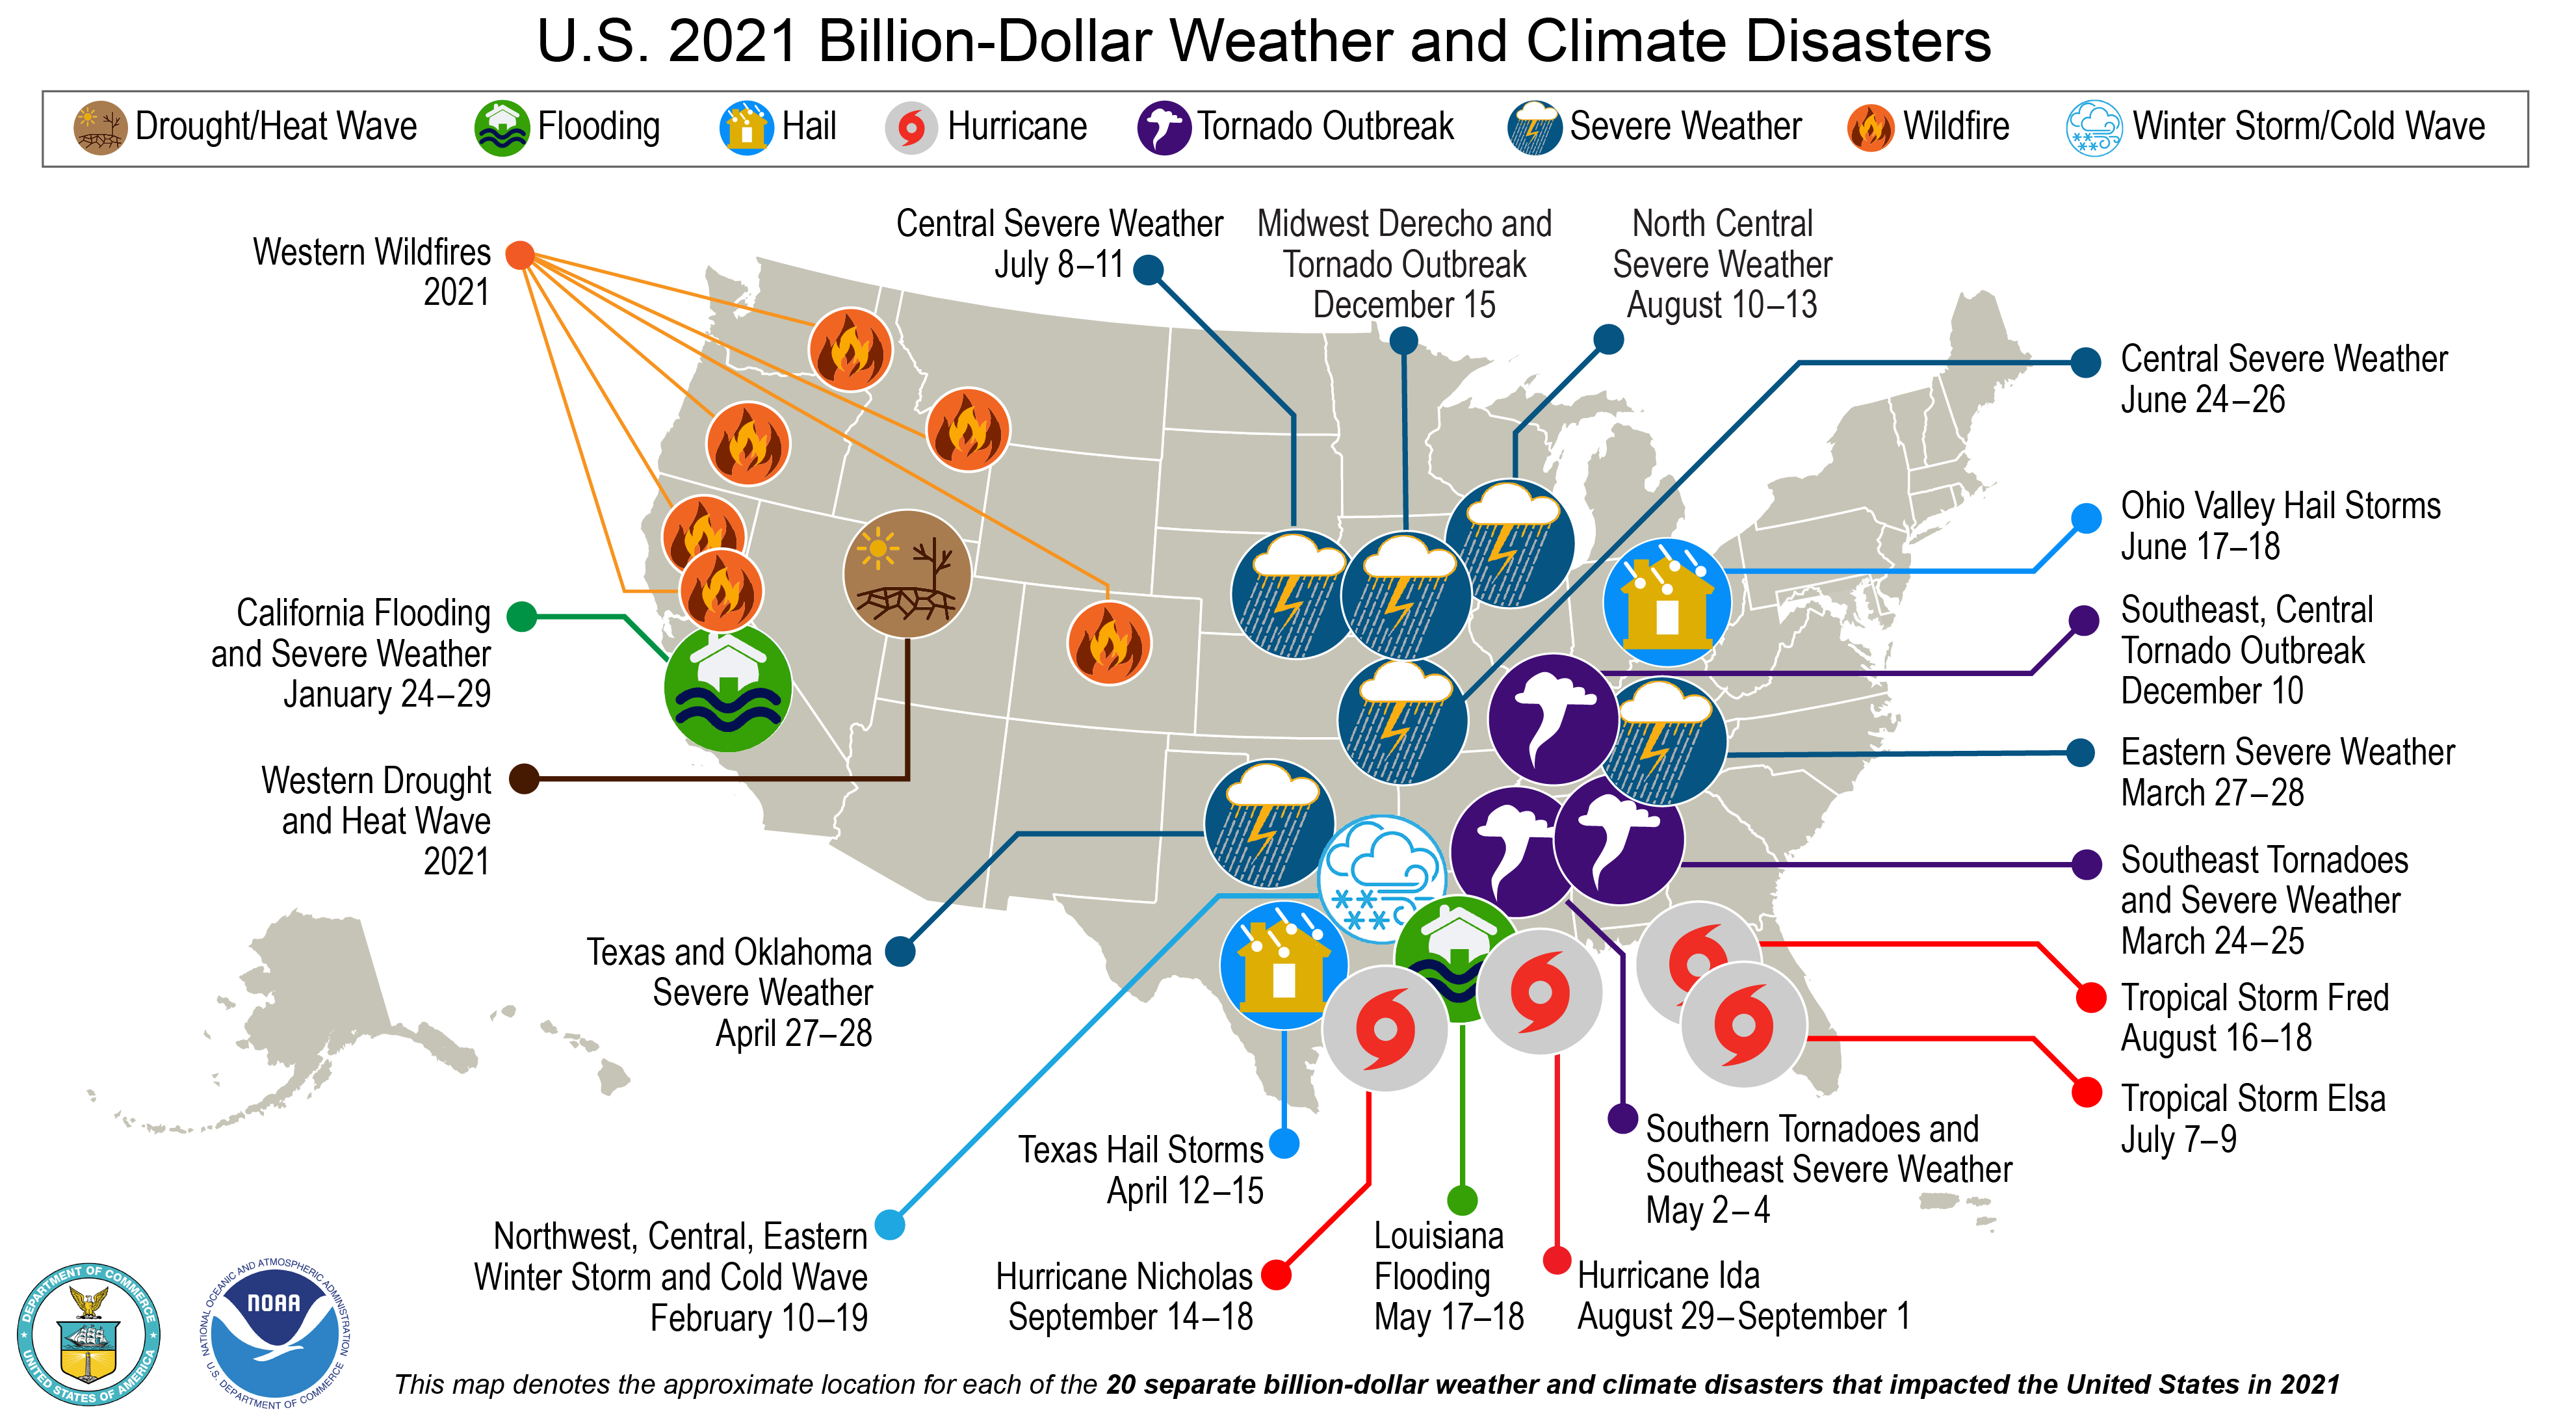
Hurricanes, wildfires and droughts – oh my! Not only was 2021 defined by lingering COVID-19 market effects and widespread supply chain woes, 20 weather and climate disasters, each with damages over a billion dollars, struck the U.S coast to coast last year. The National Oceanic and Atmospheric Administration (NOAA) reported that 2021 was the third-costliest disaster year ever, with an estimated $145 billion in total economic losses, behind only 2017’s $346 billion and 2005’s $244 billion. With over 680 lives lost, these disasters will haunt impacted communities for years to come.
Today’s Market Intel updates crop and rangeland damage estimations for 2021, providing a window into the recent impacts of natural disasters on domestic food production. The assessment puts total crop and rangeland losses from major 2021 disasters at over $12.5 billion, or 8.6% of NOAA’s total economic impact figure. Of that figure, over $6.5 billion in losses were not covered by existing Risk Management Agency (RMA) programs. Drought and wildfires alone accounted for over $3.3 billion in uncovered losses, with the additional $2.7 billion in uncovered rangeland losses likely linked to drought and wildfire. AFBF crop loss estimates do not include infrastructure damage, livestock losses, horticulture crop losses or timber losses associated with the selected weather events. Unaccounted-for damage estimates should be viewed as a minimum baseline as data to estimate these other categories are not readily available.


North Dakota suffered the most significant hit, with over $2.4 billion in incurred losses primarily made up of $500 million in damages to wheat, soybeans and corn each from persistent extreme and exceptional drought conditions. Texas was a close second with over $2 billion in incurred losses from a wide variety of weather conditions including the February deep freeze, widespread drought, a major hailstorm and Hurricane Nicholas to round it out. Over $1 billion in Texas’ damages were linked to rangeland and forage, with an additional $300 million involving destruction to grapefruit and orange groves. South Dakota’s losses mirrored those of its northern neighbor, with drought-induced losses of over $100 million each in corn, soybeans, wheat and forage. California, also plagued by drought, ticked in in fourth place, with over a billion in total damages, including half a billion in fruit and nut losses such as $125 million in almonds and over $150 million in grapes.
Rearranging crop loss data points by crop type allows us to pinpoint regional differences in damages associated with different weather conditions. Figure 2 displays overall crop losses by type across all major weather events in 2021. The other grains category includes crops like oats and sorghum, the other oilseeds category includes canola, mustard, flax and the like and the all other category includes miscellaneous crops like tobacco, sugarcane, sugar beets and mint. Seeing forage and rangeland with the most significant losses ($3.6 billion) is not surprising given the correlation between drought and rangeland. Western states are no stranger to arid conditions and vast landscapes often grazed by livestock herds. Reductions in hay stores and abysmal forage conditions forced many farmers and ranchers to liquidate cows early or pay upward of $400/ton for hay shipped across state lines. Wheat, heavily grown in the upper Plains region in states like North Dakota, Montana and Idaho, also fell victim to severe dry conditions.

Figure 3 only includes crop losses from drought and wildfire. Given drought and wildfire made up over 87% of total crop losses in 2021, there is not a major shift in the crop loss distribution. Much of the difference in the fruit and nut section ($1.05 billion to $520 million) is linked to the removal of grapefruit and orange grove losses attributable to the February cold wave and April hailstorms in Texas in addition to pecan losses from hurricanes and flooding across the South. The difference in the all other category is linked to the regional importance of sugar beets in the West that succumbed to dry conditions versus sugarcane and the many varieties of tobacco that are common in the South and mid-Atlantic.

Figure 4 only includes crop losses from the flooding events that occurred across the South, plus hurricane and tropical storm events. You will notice the drastic shift in crop types impacted. Wheat and forage/rangeland losses nearly disappear from the table, replaced in percent magnitude by soybeans, corn and cotton. The bulk of soybean losses are attributable to the summer Missouri flooding event with $97 million in damages. Over $35 million in rice losses are linked to Hurricane Ida and severe flooding in Louisiana.

Last September, President Biden signed a continuing resolution into law with a retroactive extension of disaster assistance programs, including the Wildfire and Hurricane Indemnity Program + (WHIP+), the On-Farm Storage Loss Program, Milk Loss Program and Tree Assistance Program, through 2020 and 2021. The law appropriates $10 billion out of the Treasury to the office of the secretary of Agriculture for these programs and expands WHIP+ coverage for additional causes of loss including derechos, winter storms, polar vortexes, freeze, smoke exposure and quality losses for crops. Losses due to drought are also eligible if they occurred in areas rated by the U.S. drought monitor as D2 (severe) for eight consecutive weeks or D3 (extreme drought) or higher at any time during the applicable calendar year. Though strongly appreciative of this extension and expansion, many producers have expressed dwindling confidence they will receive assistance when they most need it. As of March 9, no payments have been made for 2020 and 2021 losses and applications have not opened for producers to enroll. This means producers who faced disaster-related crop losses in early 2020 have waited over two years for support.
Conclusion
Weather and climate disasters in 2021 pummeled farms and ranches across the United States, leaving over $12.5 billion in crop and rangeland losses in their wake. The full extent of damages across the sector is likely far higher when livestock, infrastructure, timber and other ag-related factors are considered. Already in 2022, farmers and ranchers are experiencing severe drought. The stability of U.S. farms and ranches relies on their ability to be resilient under an array of climate and weather conditions. Ensuring WHIP+ and other disaster assistance program extensions provide adequate and timely support is vital – not only for farm-level stability but for a safe and secure domestic food supply.
Methodology
To begin, AFBF economists compiled a list of states impacted by weather events in 2021 that would have qualified for WHIP+. All D3/D4 droughts, hurricanes, tornadoes and wildfires were included. Affected states were selected using the National Drought Mitigation Center’s U.S. Drought Monitor and the Federal Emergency Management Agency’s presidential disaster list. States that had any form of D3/D4 drought were automatically included in the analysis. States that suffered one or more of the weather events that qualify for WHIP+ and had a presidential-declared disaster were also included in the analysis.
The analysis utilizes RMA crop insurance data to estimate losses if all crop acreage was insured with complete (100%) protection. Methodologies mimic those used by NOAA’s National Climatic Data Center to estimate losses in their annual “Billion Dollar Climate and Weather Disasters” reports (first described in Smith, Katz 2011).
RMA reports on total indemnities (total insurance compensation) paid for each cause of loss (drought, hurricane, flooding, fire, excess moisture, hot wind, etc.) in a given month for each crop type by state. Each storm is defined with a set of cause of loss types based on the weather event and its related conditions covered by WHIP+. For instance, for hurricanes, the following cause of loss filters were included: excess moisture/precipitation/rain, flooding, hurricane/tropical depression, and wind/excess wind. Data was also filtered by the month(s) the storm impacted each state. Once indemnity payments for crops were totaled, adjustments were made for losses outside insured acreage and coverage levels.
This is achieved by first calculating the percent of insured acres in each state (using 2021 data from USDA-National Agricultural Statistics Service and RMA summary of business data). It is assumed all acreage of a given crop has been equally impacted by a particular disaster. Then RMA coverage level data is used to find the average coverage rate for each crop in each state. Based on these stats, a factor approach defined as 1/ [(% acres insured) (average coverage level %)] is utilized to come up with a multiplier to estimate 100% of losses. This was repeated for crops in each affected state and totaled.
Using a real-life example: In Florida, 56% of pepper acreage was insured in 2020. Of the covered pepper acreage in Florida, insurance covered an average of 62% of losses. Following the formula described above, Florida pepper indemnities were multiplied by 1/(0.56*0.62), or 2.88, to estimate 100% of losses.
Additional related loss estimates were calculated using reported indemnities paid out under code 55, or the “ARPI/SCO/STAX/MP/HIP WI Crops Only” RMA cause of loss category. RMA is unable to differentiate the cause of loss for indemnities paid out under code 55, therefore it is assumed all losses to “pasture, rangeland, forage” were due to a qualifying disaster in the month(s) the disaster took place. Pasture, rangeland and forage acreage coverage was calculated using a national Natural Resources Conservation Service private rangeland estimate.
It is important to note that AFBF estimations include some losses that would not have traditionally qualified under the framework of ad hoc disaster programs such as WHIP+. For instance, WHIP+ assistance was not eligible on crops intended for grazing (rangeland). Clearly, with uncovered rangeland losses of over $3.5 billion related to 2021 disasters, farmers and ranchers still face a major hurdle to recovery.
