America’s Farmers Serve Up Your Football Favorites

Bernt Nelson
Economist
While we may be rooting for different teams this Sunday, the more than 120 million people expected to tune in to watch Super Bowl LIX are fairly united on one thing: the food that comes with it. Whether you are tailgating at the game itself or joining friends for a watch party, most of your favorite gameday foods come from family farms right here in the U.S.! In fact, Americans will eat about 1.47 billion chicken wings along with other favorites. But it’s a long way from the farm to your table for many of these foods, and each step in the supply chain eats away at the farmer’s share of the food dollar. This Market Intel will break down a few football favorites foods and estimate how much of every dollar spent at the grocery store goes back to the farmer for each.
Author’s note: Data in this Market Intel is based on average retail prices reported by USDA and the U.S. Bureau of Labor Statistics (BLS) via the St. Louis Federal Reserve Bank (FRED) where possible and calculated estimates for prices where data is absent. Actual retail prices will vary as they say.
America’s Favorite, Wings!
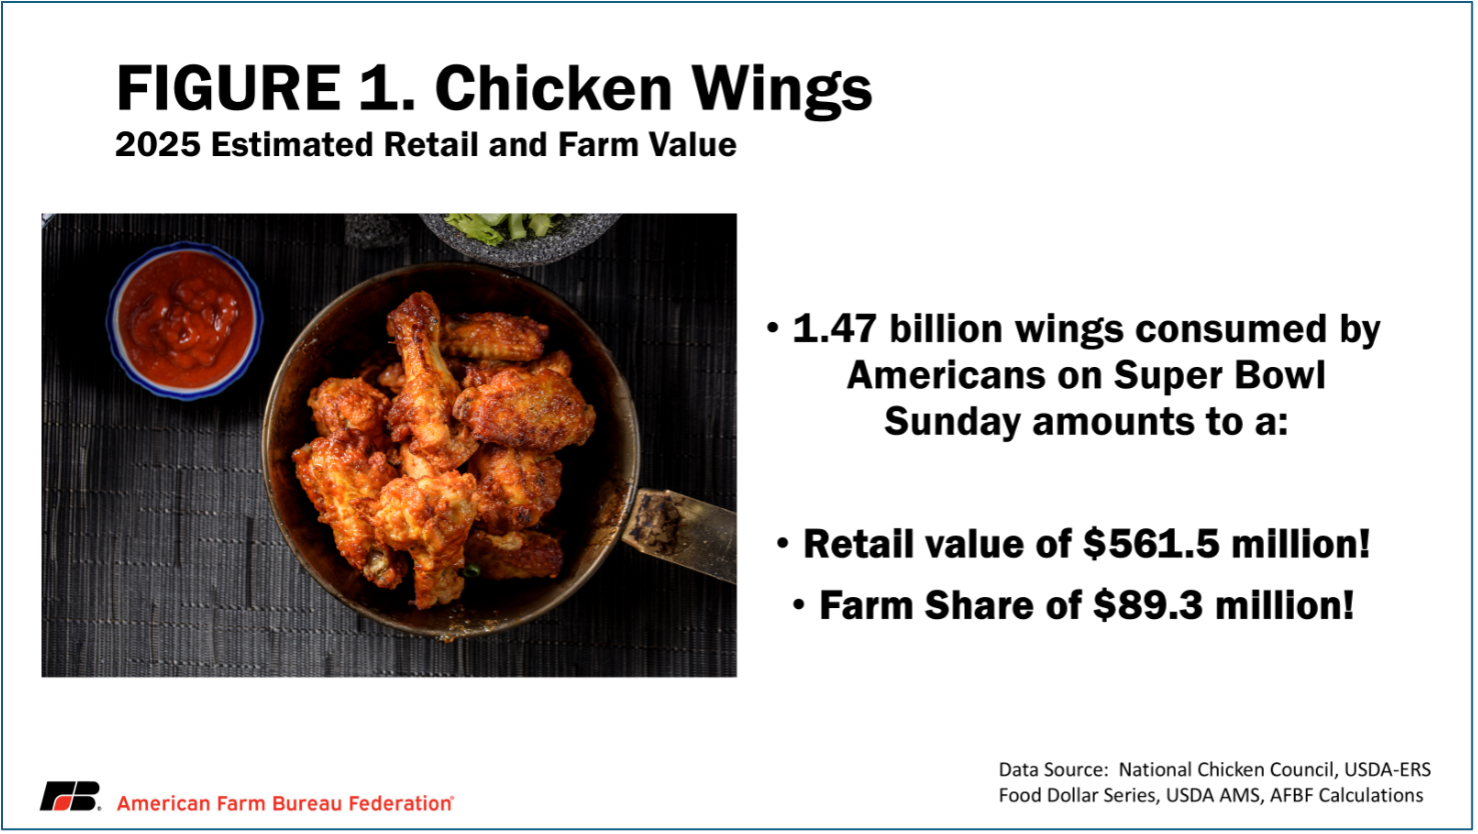
Americans will consume about 1.47 billion chicken wings on Super Bowl Sunday. Years ago, chicken wings used to be discarded or simply boiled for soup stock because of their small size and limited meat. Today, they are covered in spices and sauce and have become a value-added favorite! According to the latest national chicken report from USDA-Agricultural Marketing Service (AMS), the national average price for whole chicken wings is $1.91 per pound. At this price, farmers will receive about $0.30 per pound of chicken wings. If American’s consume 1.47 billion wings, that’s $561.5 million worth of chicken wings by value, contributing approximately $89 million dollars to family farms!
Tortilla Chips
According to BLS, the average price for a bag of chips was $6.32 in December 2024. It takes about 1.25 ounces of corn to make 1 ounce of corn tortilla chips. Using USDA’s 2023/24 Market Year Average price for corn, $4.55 per bushel, the farmer’s share of a bag of chips is about 1.5% or 10 cents per bag.
Veggies – Carrots and Celery
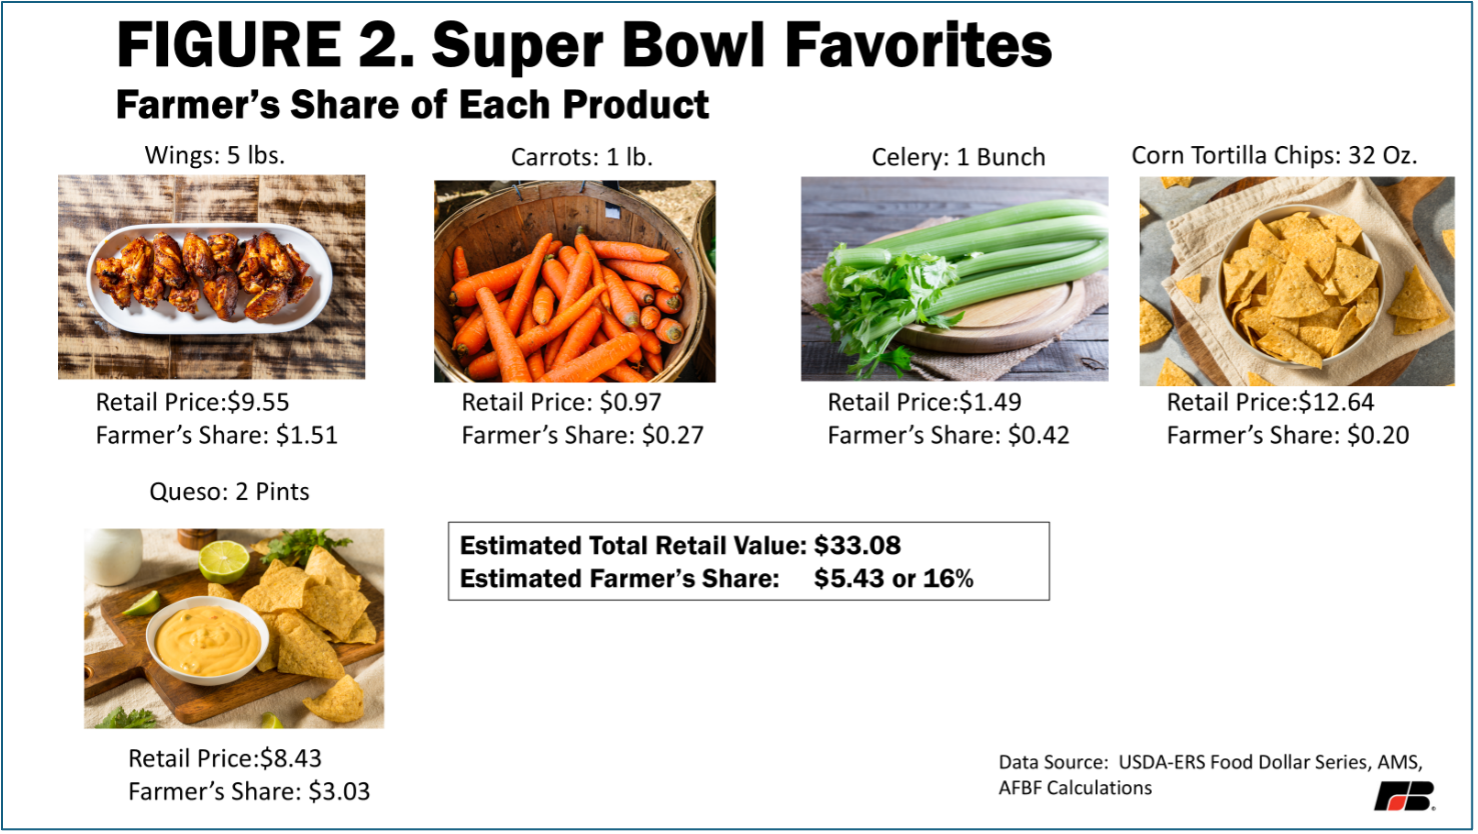
It’s hard to enjoy wings without adding the classic sides: celery and carrots. Raw vegetables have a much more direct route from the farm to the table. According to USDA, the farm share of the consumer dollar for fresh vegetables is about 28%. Using this figure, the farmer’s share for 1 pound of carrots and 1 bunch of celery is about 69 cents of the $2.46 retail value.
Dairy
Most recipes call for about 12 ounces of cheddar cheese for each pint of queso dip. The average price for 1 pound of cheddar cheese was $5.62 in December 2024. The farmer’s share of the consumer dollar for processed dairy products is about 36%. This means the farmer’s share for two,12-ounce blocks of cheddar cheese is about $3.03.
Summary and Conclusions
This Market Intel is meant to provide a snapshot of how much money goes back to U.S. farmers as Americans across the country dig into classic Super Bowl Sunday foods. When we add up all the football favorites on our list, American farms receive approximately $5.43, or 16% of the total estimated retail value of $33.08. Out of all the items on our list, the cheese used to make queso dip sends the most money back to the farm at $3.03, while a bag of corn tortilla chips sends back just 10 cents per 16-ounce bag. It’s often said that a farmer’s day is measured in acres, not hours working hard to feed the world. While you are cheering and enjoying those wings or another favorite, remember that you are supporting the nation’s farmers who work tirelessly to grow the food on your table: so if you can, don’t forget to thank a farmer!
A Note on Methodology
This Market Intel primarily uses two tools provided by USDA’s Economic Research Service (ERS) to estimate the farmer’s share of every dollar spent on a few of America’s favorite gameday foods: the Food Dollar Series and the Price Spreads from Farm to Consumer.
ERS publishes the annual Food Dollar Series to estimate annual expenditures by U.S. consumers on domestically produced foods. It calculates what percentage of every dollar spent on food goes to different parts of the supply chain (Figure 3). According to this series, the farmers received about 15.8 cents per average dollar spent on food in 2023.
ERS’ Price Spreads from Farm to Consumer compares the price paid by consumers for food to the money farmers receive for their products. Using this tool, we can estimate the percentage of retail value a farmer receives, which varies by product, with farmers typically receiving more for unprocessed products like fresh vegetables, compared to processed products like corn chips.
