Another Year of Explosive H-2A Growth
Veronica Nigh
Senior Economist

Veronica Nigh
Senior Economist
Earlier this week, the Department of Labor released fourth quarter and full fiscal year usage data for the H-2A program. Given agriculture’s ongoing struggle to recruit domestic workers and a very tight U.S. labor market overall, it should be no surprise that usage of the H-2A program reached new highs again in fiscal year 2022 (October 2021-September 2022).
Current U.S. Employment Picture
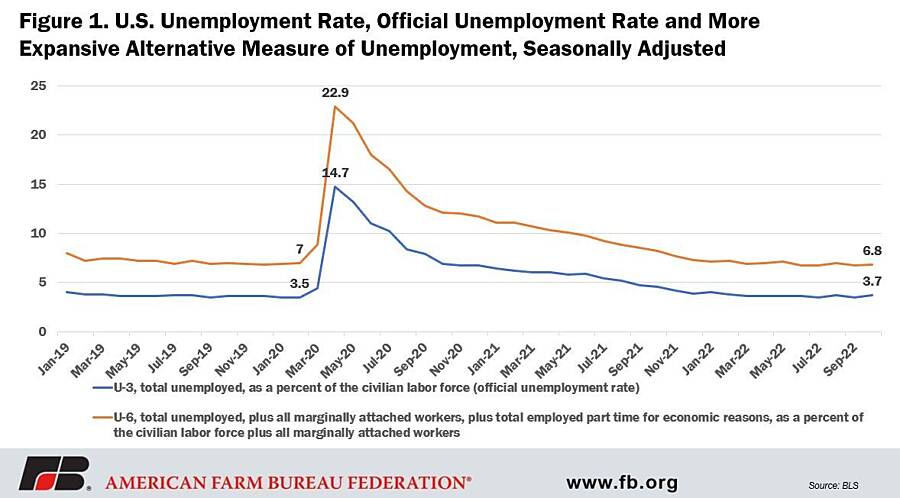
The October 2022 unemployment rate was 3.7%, in the same 3.5% to 3.7% percent range it has been in since March. A more expansive calculation of unemployment, which includes the total unemployed, plus all marginally attached workers, plus total employed part time for economic reasons, as a percent of the civilian labor force plus all marginally attached workers was 6.8%. (Marginally attached are those persons not in the labor force who want and are available for work, and who have looked for a job sometime in the prior 12 months but were not counted as unemployed because they had not searched for work in the four weeks preceding the survey.) The total number of employed people was 158.6 million while the number of unemployed persons reached 6.1 million, 19.5% of which belong to the grouping of the long-term unemployed (those jobless for 27 weeks or more). The labor force participation rate, at 62.2%, and the employment-population ratio, at 60%, were mostly unchanged in October and have shown little net change since early this year.
Let’s compare the current situation to February 2020, prior to the COVID-19 pandemic. In February 2020, the unemployment rate was 3.5%. The unemployment rate factoring in marginally attached workers and those employed part time for economic reasons, as described above, was 7%. The total number of employed people was 158.9 million while the number of unemployed people was 5.7 million, 19.1% of which were among the long-term unemployed. The labor force participation rate, at 63.4%, and the employment-population ratio, at 61.2%, were about 1.2 percentage points higher than the level we see today.
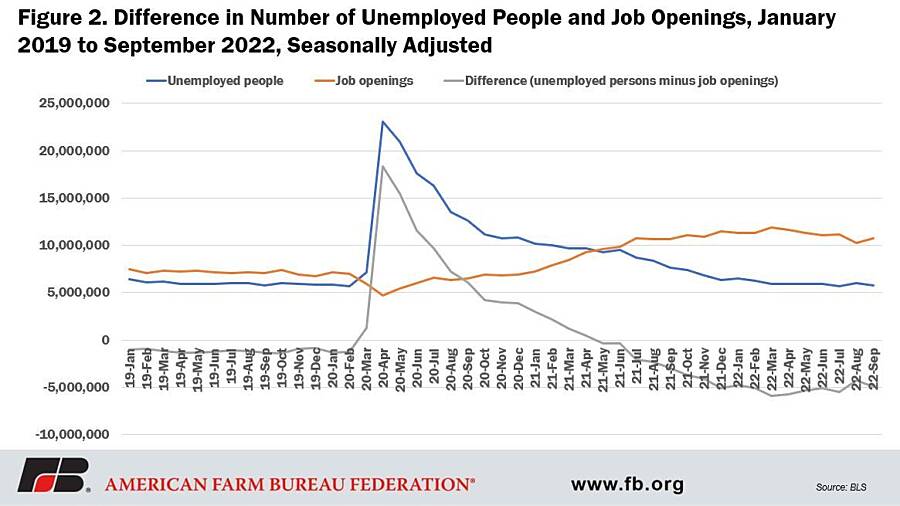
A lot has changed in the labor market in the last 30 months, with rising wages and seemingly ever-present help wanted signs, but it’s important to remember that the pre-COVID labor market was tight. In February 2020, there were 5.7 million unemployed persons, but a little over 7 million job openings, which means pre-COVID the labor market was “short” nearly 1.3 million workers.
When COVID hit, many employers were forced to shed employees, leaving more than 23 million workers without jobs in April 2020. As we learned more about COVID, and the economy began to rebound, those businesses that survived the downturn began trying to hire back employees. As they did, however, they found the competition was stiff.
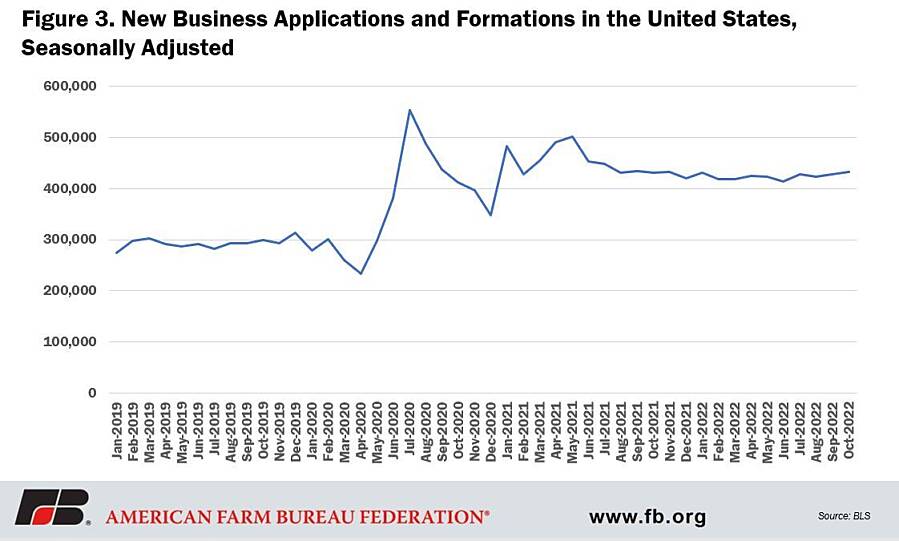
A lot has been written about the impact of retiring baby boomers, limited childcare and the impact of unemployment benefits on the labor participation rate. But a significant – and largely overlooked –factor in the tight post-COVID labor market is the huge increase in the number of businesses that started in the post-COVID economy. People who were once employees wondered if they could do it better, took the leap, started their own business and began hiring their own employees. And that trend doesn’t seem to be going away, at least in the near term. To put the increase into perspective – new business applications and formations averaged about 293,000 per month in 2019. In the last six months of 2020, when the transmission cause of COVID was known, but before large-scale roll out of the vaccine, business starts averaged 438,000 per month. In 2021, that number rose even further, averaging 449,000 per month. In the first 10 months of 2022, the number has fallen slightly to a monthly average of 423,000 per month. Even at the slightly lower rate, the average number of business starts January through October 2022 is a whopping 45% higher than during the same period in 2019. According to the latest Bureau of Labor Statistics data, the labor market remains short nearly 5 million workers.
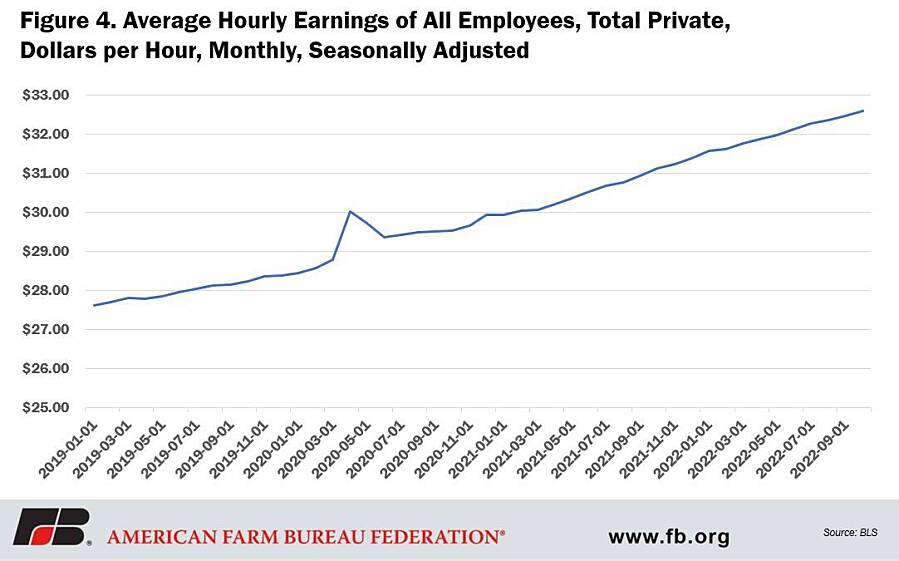
The predictable outcome for all this competition for workers is higher wages. The average hourly earnings of all private employees (seasonally adjusted) in October 2022 were $32.58 per hour. Over the 30-month period of May 2020 through October 2022, wages have risen by 9.7%. This compares to the 30-month period preceding COVID (September 2017 through February 2020), in which the increase was 7.8%. Of course there is a good amount of variation across industries, but the trend is the same no matter the part of the economy; wages are rising at a higher rate in the post-COVID economy as employers compete against each other for elusive employees.
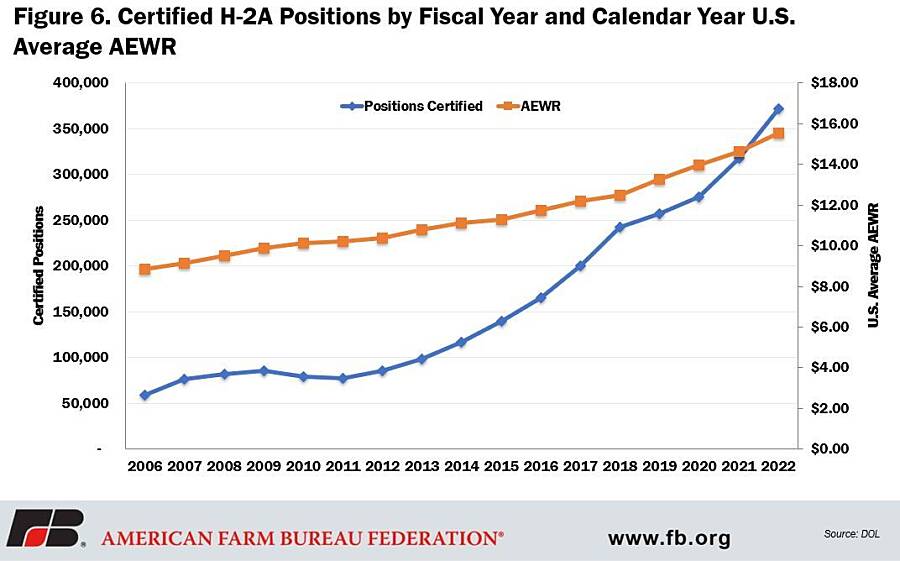
This article is about fiscal year 2022 H-2A positions, not the labor market at large, but the context of the tightness in the overall labor market is important for understanding what the H-2A usage data reveals. In fiscal year 2022, DOL certified 371,619 H-2A positions, an increase of 17% over fiscal year 2021. This large increase followed a similarly large increase in fiscal year 2021, when the number of certified positions increased by 15.3% over fiscal year 2020. Nearly 100,000 (96,189) more positions were certified in fiscal year 2022 than two years ago in fiscal year 2020. To further put this increase in context, just 10 years ago in fiscal year 2013, fewer than 100,000 positions were certified in total (98,813).
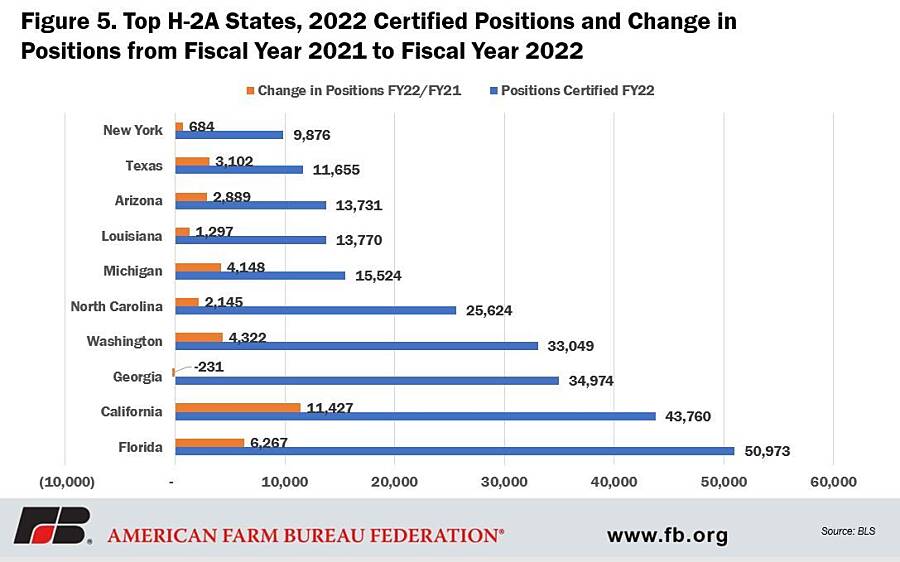
The top 10 states that utilized the H-2A program in fiscal year 2022 remained the same as in fiscal year 2021. From the largest number of certified positions to the smallest the top 10 states were: Florida (50,973), California (43,760), Georgia (34,974), Washington (33,049), North Carolina (25,634), Michigan (15,524), Louisiana (13,770), Arizona (13,731), Texas (11,655) and New York (9,876). Unfortunately, if a state does not crack the top 10 users list, there are no publicly available statistics for H-2A program use. DOL used to provide annual performance reports that listed the usage for each state but the department hasn’t provided a report since fiscal year 2016. It is beyond time for DOL to provide this data, so that each state can fully appreciate the role this program plays for its state’s agricultural sector. The top 10 states account for 252,936, or about 68%, of the 371,619 total H-2A positions. But this also means that 118,683 positions were certified in the remaining 40 states. Those states also deserve full information.
It is also worth noting that in addition to strong growth in the number of certified positions in fiscal year 2022, there was also a 15% increase in number of H-2A applications that were filed. This suggests that the universe of operations that are utilizing the program is also growing, rather than the growth coming strictly from existing operations. The average number of certified positions per application in fiscal year 2022 was 22; the same number as it has been since fiscal year 2019.
This new record usage of the H-2A program was in spite of a record-high U.S. Adverse Effect Wage Rate – the rate most users of the program pay workers. In calendar year 2022, the U.S. average AEWR was $15.56, up 6.4% from 2021. The 2023 AEWR will be revealed on Nov. 23 at 3 p.m. when USDA releases the Farm Labor Report . The 2023 AEWR, which is officially published in late December in the Federal Register, is derived from the November Farm Labor report’s 2022 annual weighted average hourly wage rate for field and livestock workers combined. In the November 2021 Farm Labor Report, that data was on page 25. We will provide an analysis of the 2023 AEWR once it is released.
Conclusion
The incredibly tight labor market is taking its toll on businesses across industries. Two back-to-back years of double-digit growth in the H-2A program is a strong indication that the U.S. agricultural sector has been particularly hard hit. For a growing number of operations, the H-2A program is the only viable option for staffing their seasonal on-farm jobs. With rising input costs across the board, but not necessarily rising prices for their output, farmers and ranchers will be watching next week’s release of the 2023 AEWR very closely.
