Assessing the Possibility of Below Trend U.S. Corn Yield
John Newton, Ph.D.
Chief Economist

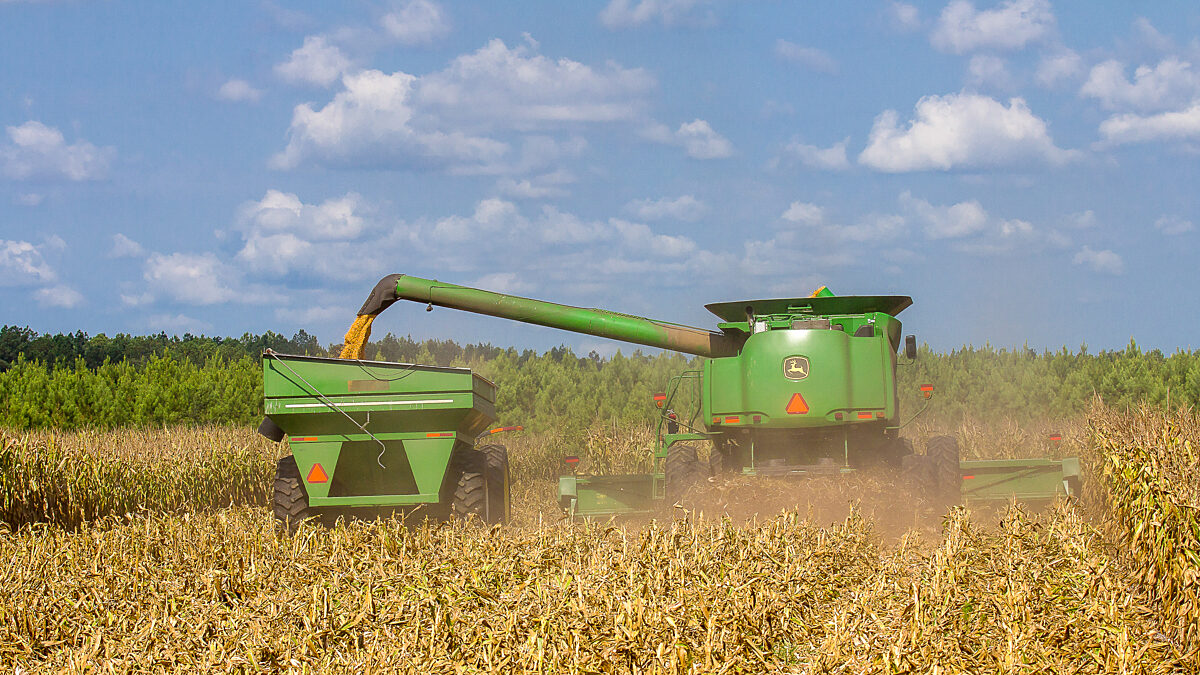
photo credit: North Carolina Farm Bureau, Used with Permission
John Newton, Ph.D.
Chief Economist
Following an increase in stock-to-use levels in 2016/17, and given USDA projections for total use to decline 1.5 percent in 2017/18, the fundamentals driving the corn market at this point in the growing season are weather-driven supply expectations, more commonly known as mother nature.
Adverse changes in temperature or precipitation would indicate a shorter crop than projected, while favorable weather would point toward another bumper crop. The former is more likely. USDA is currently projecting for corn yields to drop 2 percent in 2017/18 to 170.7 bushels per acre.
Weather expectations drove new-crop corn prices to contract highs of $4.16 per bushel in early July. Following the June Acreage report and July World Agricultural Supply and Demand Estimates report, more favorable temperatures and precipitation led to prices falling toward $3.90 per bushel. Put simply, the market is trading on the weather premium.
Weather Driving Corn Prices
While day-to-day changes in the weather are leading to more variability in corn prices, there is growing sentiment in the industry that the drought in the High Plains and the excessive rainfall experienced during planting and early in the growing season will ultimately lead to corn yields below USDA’s current projection of 170.7 bushels per acre. Some in the trade are even anticipating a corn yield this year at or below the linear trend of 166.8 bushels per acre.
Consider the following industry forecasts: Informa Economics recently updated their corn production forecast to 13.9 billion bushels, below USDA’s estimate of 14.3 billion bushels, with an average yield of 166.2 bushels per acre. GRO-intelligence recently revised their yield projections from 164.2 to 160 bushels per acre. Prior to the July 12 World Agricultural Supply and Demand Estimates, the average trade estimate was for a corn yield of 166.8 to 170.7 bushels per acre. Finally, based on an informal online survey conducted by AFBF’s Market Intel, 69 percent of survey respondents estimated a final corn yield below 165 bushels per acre and 31 percent were above.
Based on current crop conditions alone, there’s little question the 2017/18 corn yield will fall short of the record yield of 2016/17. USDA’s July 24, 2017, Crop Progress report indicated that 62 percent of the corn crop was in good-to-excellent condition, 14 percent below last year, Figure 1.

As a percentage of 2016’s corn production volume, 87 percent of the corn production area is in poorer conditions than last year. Additionally, 69 percent of the corn production area has crop conditions that are at least 10 percent worse than last year. The High Plains and “I-states” represented nearly 50 percent of U.S. corn production in 2016 and have crop conditions ranging from -19 to -34 percentage points below last year. Thus, 2017 yields are likely to turn toward -- or go below – the trend.
Uncertainty Remains
The impact on corn production, given expectations for harvested acres of 83.5 million acres, varies depending on yield expectations. A short crop could potentially pull down ending stocks. For every one bushel decline in crop yields, total production declines by 83.5 million bushels – holding harvested area constant. Thus, an average crop yield of 166 bushels per acre, relative to USDA’s projection of 170.7 bushels per acre, could result in a 500 million bushel decline in ending stocks given USDA’s projections of harvested area, consumption and beginning stocks.
However, the natural hedge comes in to play with lower crop yields. The natural hedge is the regional yield-price relationship that works to offset yield losses with higher prices -- thereby helping to smooth farm revenue across marketing years. If national average yields decline, national average prices are very likely to increase. Using empirical data as a guide, the likely consumption category impacted by higher corn prices is exports – feed and residual use and ethanol are less impacted. Reduced exports in the face of higher corn prices would reduce consumption and could potentially offset the impact of lower crop yields on carryout stocks. A substantial yield shock may be needed to significantly reduce ending stocks.
During the droughts of 1998 and 2012, corn yields were observed 28 percent and 22 percent below the linear trend, respectively. The flood of 1993 saw yields 18 percent below trend, but those growing conditions differ from 2017.
Crop conditions at this point in the growing season raise concerns for crop yields. However, 2017 is not 2012, nor 1988. Currently, the crop in good-to-excellent conditions is at 62 percent and is well above the conditions observed during the drought years of 1988 and 2012 at 20 percent and 26 percent, respectively, as of week 29, Figure 2.

A 20 percent decline in yields below trend, i.e. 134 bushels per acre, seems unlikely at this point. A less substantial yield shock is more likely in 2017 given current crop conditions. For example, a 5 percent yield shock below a linear trend would result in an average U.S. crop yield of 159 bushels per acre and would represent a billion bushel decline in production relative to current projections.
Implications
USDA’s weather-adjusted trend yield model indicates that the elasticity in corn yields is more sensitive to July weather than May planting progress. July temperatures above the average level of 74 degrees negatively impact corn yields, while July rainfall above 3.9 inches generally increases yields (although the relationship is non-linear).
While weather concerns remain, keep in mind that the key pollination period continues through the end of July. For late-planted corn, the pollination period may extend into August. Rains or cooler temperatures in the coming days could quickly change these expectations and would drive prices lower. For soybeans, the key periods of the growing season continue through August, but similar yield concerns are present.