Decoding USDA’s FMMO Recommendations – Extended Edition
Daniel Munch
Economist
USDA-Agricultural Marketing Service’s proposed amendments to the 11 Federal Milk Marketing Orders (FMMOs), released July 1, are a mixed bag for dairy farmers, with the extent of the benefits, or lack thereof, hinging heavily on a farmer’s location.
The recommendations, which reflect the perspectives of USDA and the secretary of Agriculture, are based on their interpretation of testimony presented during the Carmel, Indiana, hearing, which spanned from Aug. 23, 2023, to Jan. 30, 2024, as well as post-hearing briefs submitted by stakeholders.
Proposed amendments to the minimum pricing formulas include changes to:
- Milk composition factors
- Surveyed commodity products
- Class III and IV formula factors
- The base Class I skim milk price
- Class I differentials
This article walks through the adjustments recommended under these five categories and the associated potential impacts to Class prices and FMMO pool values using a static analysis, similar to that used by USDA. Buckle up, it’s a long one. If you prefer a shorter, high-level version of this analysis, that can be accessed here.
Previous articles including How Milk Is Priced in Federal Milk Marketing Orders: A Primer, Tracking Federal Milk Marketing Order Policy Developments and Tracking Federal Milk Marketing Order Policy Developments | Part 2 provide an overview of the FMMO system and the events that spurred the recent hearing process. USDA’s landing page for the current hearing process can be accessed here. Other related Market Intels and AFBF hearing testimony can be accessed here.
Background
The Federal Milk Marketing Order system establishes provisions under which dairy processors purchase milk from dairy farmers supplying specific marketing areas. One of the primary functions of the federal order structure is the calculation of minimum uniform prices paid to farmers. USDA does this by attempting to calculate the value of raw milk used in a dairy product based on the market prices of several key dairy products.
Currently, the FMMO system categorizes milk into one of four classes, based on what dairy products it is used to make. Each class of product has a different value in the market and the price dairy processors pay is intended to reflect the final market value of those goods. The four class prices are currently as follows: Class I – milk used for beverages; Class II – milk used in soft products like ice cream, sour cream and cottage cheese; Class III – milk used in hard cheese and spreadable cheese; and Class IV – milk used to produce butter or powdered dairy products.
- Milk Composition Factors
In the FMMO system, USDA surveys wholesale prices of cheese, butter, whey and nonfat dry milk from dairy product manufacturers. Once average prices are established for these products, USDA uses a set of fixed formulas to derive the value of milk and milk components in all four classes that is used to set minimum prices for dairy farmers.
At the most basic level, milk can be separated between its butterfat (fat) content and its skim milk content. The skim portion of milk contains solids broadly categorized as nonfat solids, which includes protein (such as casein and whey proteins) and other solids which includes lactose (milk sugar) and minerals (sometimes called ash).
In order to account for the value of these nonfat solids in milk, USDA’s pricing formulas assume certain concentrations that 100 pounds of skim milk contain – these are known as composition factors. Currently, the formulas assume that 100 pounds of skim milk contains 3.1 pounds of true protein and 5.9 pounds of other solids for a total of 9 pounds of nonfat solids.
These assumed composition factors (also often referred to as component factors) affect the minimum prices that milk handlers are required to pay for milk, though the impact varies depending on the FMMO involved. In the Arizona, Southeast, Florida and Appalachian FMMOs, handlers pay for skim milk based on its volume (per cwt), regardless of the actual component levels; this is known as skim/fat pricing. In these cases, they pay for the pounds of skim milk and the pounds of butterfat in the milk for all classes of milk. In the other seven orders, handlers pay based on the skim and butterfat in the milk for fluid milk products (Class I), but for all other classes (II, III and IV), they pay based on the actual component levels in the milk they purchase (this is known as multiple component pricing). As a result, changes to milk composition factors mainly affect the prices paid for Class I milk in all 11 orders and for Classes II, III, and IV in the skim/fat orders, but they don't affect prices for Classes II, III and IV in multiple component orders. Increases in the composition factors for protein and other non-fat solids increase prices for farmers.
Average milk component levels, a key factor in the FMMO pricing formula, have increased since they were last set at the time of order reform in 2000. Due to a variety of farm innovations such as improved nutrition management, better genetic selection, a shift toward brown cows (which tend to produce more protein per cwt. of milk) and improved husbandry practices, dairy farmers have been able to respond to market signals that put a higher value on butterfat, protein and other solids. Adjusting the formula factors to reflect these increases in components and ensure dairy farmers are receiving a more accurate value for their milk is important for aligning milk values across classes. In its recommended decision, USDA proposes increasing the skim milk composition factors as follows:
Applying these increased composition values to the underlying formulas over the past four years would have resulted in an increase in all Class prices. On average, from 2020-2023, Class I prices would have increased 46 cents/cwt; Class II prices would have increased by 32 cents/cwt; Class III prices would have increased by 57 cents/cwt; and Class IV prices would have increased by 32 cents/cwt. This is a logical update to the system and positive change for farmers
Proposed Implementation Delay
Interestingly, the recommended decision includes a 12-month delay for implementing the increases in composition values. This means that while all other adjustments would take effect when the new order regulations are implemented, the increases in composition values would be postponed for a year. USDA claims this delay is to allow producers who use risk management tools, such as CME futures and Dairy Revenue Protection insurance, to adjust their positions and mitigate potential financial harm from regulatory changes. There are, however, substantial downsides to this delay. The benefits of increased component values (that is, increased Class skim prices) would be lost for an entire year. As a result, dairy farmers could miss out on more than $200 million in overall pool value increases during that period (based on a prior four-year annual average increase).
This delay, by maintaining outdated composition factors for an extra 12 months, would depress Class I prices and increase the likelihood of depooling, part of the disorderly marketing conditions that the new rules aim to avoid.
2. Surveyed Commodity Products
Prices calculated under the FMMO system are intended to reflect fair market prices based on current supply and demand for a variety of dairy products. To accomplish this, USDA surveys the weekly sales price, quantity and moisture content of five dairy commodities sold by processors who sell 1 million pounds or more of those dairy commodities. The average prices collected from these surveys are then used as the basis for the first step in calculating minimum prices paid to farmers. Higher prices captured in the marketplace for surveyed products generally lead to a higher price paid to farmers. If the prices of the surveyed products do not fairly reflect the mix and value of products purchased by consumers, the price being paid to farmers don’t reflect the market and could lead to the undervaluing of farmers’ milk. A deep dive into these dynamics can be read here: Dairy Products Pricing Report Captures Small Portion of Sales Volumes.
Currently, USDA uses a weighted average of the survey prices of cheddar cheese in 40-pound blocks and cheese in 500-pound barrels in order to reflect the value of cheese within FMMO price formulas. Barrel cheese is primarily meant for further processing into processed cheeses, while block cheddar, though also suitable for further processing, is generally produced for use as natural cheese with minimal additional processing, such as cutting into consumer packages or shredding. USDA’s recommended decision proposes the elimination of 500-pound barrels from the survey, which means the cheese value would only be based on 40-pound cheddar cheese blocks. USDA and other proponents, including AFBF, have argued that the cheddar blocks are more versatile and their price is much more widely used as a benchmark across the cheese industry generally, so that it better reflects the broader cheddar cheese market. Barrel prices also have shown greater volatility, and their growing divergence from block prices in recent years has led to less stable price outcomes for farmers. Continuing to include both products in the survey – especially in roughly equal proportions, as they are now – undermines the goal of accurately determining the minimum value of raw milk used for cheese, and so creates disorderly marketing conditions.
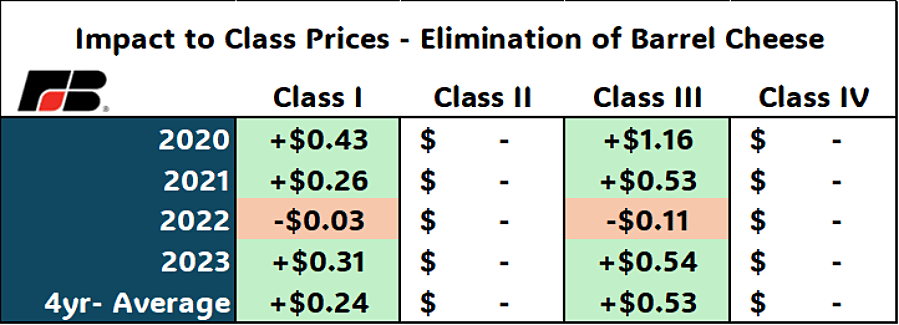
The cheese price directly impacts the protein price used to calculate Class III milk, the result of which is also used in the calculation of Class I milk. Had the 500-pound barrel price been excluded from the cheese price within the FMMO formulas over the past four years, the Class I price would have seen an average increase of 24 cents/ cwt, while the Class III price would have risen by an average of 53 cents/cwt.
While this change could increase farmer prices, it’s more important impact would be to better align the cheese milk price with the price that cheese makers are getting for their cheese.
3. Class III & IV Formula Factors (Make Allowances)
These milk price formulas have to account for the manufacturer’s costs. Turning raw milk into cheese, for example, requires labor, non-dairy ingredients (such as salt and cultures), energy, testing and packaging. These costs for each benchmark product are represented with a fixed deduction per pound in the FMMO price formulas, called a ‘make allowance.’ Generally speaking, the bigger the make allowance, the lower the price the formula gives to producers. Make allowances are based on an estimate of the costs of making a pound of butter, cheese, whey or dry milk powder, and are intended to be large enough to encourage the construction and maintenance of sufficient processing capacity to meet market demand.
Like other formula factors being considered in this process, USDA sets these make allowances based on testimony from various stakeholders. In the Carmel, Indiana hearing, the data was a self-selected sample of self-reported manufacturers’ cost data, but manufacturers who knew exactly what the data would be used for; so these make allowances do not necessarily reflect the true costs of processing. This topic was explored more in-depth here.
Make allowances that are set too high could lead to undervaluing the milk dairy farmers produce harming their ability to cover farm expenses. USDA’s recommended decision includes large increases in all make allowance factors, as presented below.
Additionally, USDA recommended an increase to a fixed factor called the butterfat recovery factor, which reflects the percentage of butterfat in raw milk that is recovered during the cheesemaking process. It was traditionally set at 90%, but due to advancements in cheesemaking technology, USDA accepted a proposal that was made to increase it to 91%, acknowledging that most modern cheese plants can achieve this recovery rate. The cheese yield factor was also increased because a higher butterfat recovery rate means more butterfat is available in the milk to be turned into cheese, thus leading to a higher overall yield. Make allowance increases bring class prices down, while increases in butterfat recovery and butterfat yield factor raise class prices.
If the recommended increases in make allowances, butterfat recovery factor and butterfat yield factor in cheese had all been implemented between 2020 and 2023 they would have reduced Class I prices by an average of 81 cents/cwt; Class II prices by an average of 74 cents/cwt; Class III prices by 89 cents/cwt; and Class IV prices by 74 cents/cwt. This corresponds to a 3-6% decline in Class prices.
This change will have the largest impact, by far, on farmer prices and was opposed by AFBF, who argued that more comprehensive data was necessary to take this much money away from farmers, particularly when the current make allowances have been big enough for manufacturers to build or expand cheese plants in various regions of the country.
4. Base Class I Skim Milk Price
The skim portion of fluid milk (Class I skim milk) has been based on some combination of the values of Class III (cheese) and Class IV (butter and powder) prices. Prior to 2019, the formula to calculate base Class I skim milk was the higher of advanced Class III (cheese) and Class IV (butter and powders) skim milk prices. The 2018 farm bill swapped the “higher-of” formula for the simple average-of advanced Class III and IV skim milk prices, plus 74 cents.
COVID-19 pandemic-induced market conditions quickly revealed a problem with the new formula. Significant spreads between Class III and Class IV prices, paired with the delay associated with advanced Class I milk pricing, resulted in more money being paid out in Class III component values than what was collected from processing plants across all classes of milk. Worse, the high manufacturing milk prices meant manufacturers could avoid paying into the pool by pulling their milk our of the pool (“de-pooling”), which gutted the price of farmers whose milk stayed in the pool. In 2020 alone, over $700 million was lost in the revenue pool just from the lower Class I price; those in the pool lost more as de-pooling also drained value out of the uniform price pool. During the pandemic, this imbalance was linked to a change in eating habits during the lockdown; however the losses in pool value have continued through early 2024, as cheese milk (Class III) value fell and butter/powder (Class IV) values took their turn on top. Cumulative pool losses, just from lower Class I prices and not counting depooling, have breached $1.2 billion since the formula went into effect in May 2019.
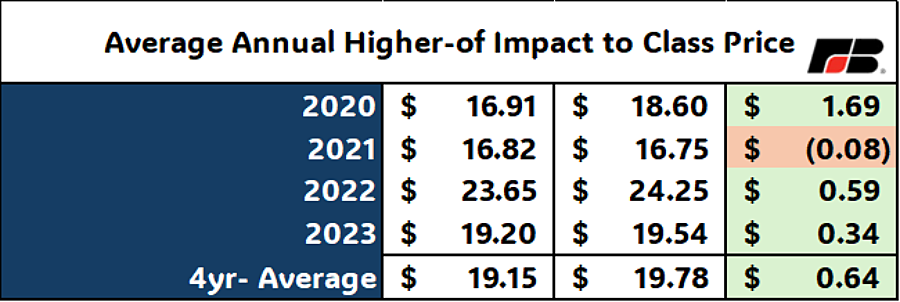
USDA reviewed six proposals to amend the base Class I skim milk price and recommends returning to the “higher-of” Class III or Class IV skim milk price formulas used prior to the 2018 farm bill. Had the “higher-of” skim milk price been in place between 2020 and 2023 average Class I prices would have increased by 64 cents per cwt.
This return to the “higher-of” was the number one priority of dairy farmers who gathered at AFBF’s Federal Milk Marketing Order Forum in Kansas City in 2022 and a priority of AFBF at the hearing. So this is an appreciated improvement by USDA.
But wait! There’s more! Instead of the simple switch back to the easy to understand “higher-of,” USDA recommends the addition of an adjuster for extended shelf life (ESL) milk. This complicated adjustment is designed to account for differences in the timing and costs of milk used in ESL products, which have a longer shelf life compared to other milk products. The adjuster is calculated as the rolling average of the differences between the higher-of and the average-of the advanced Class III and Class IV skim milk pricing factors over the prior 13 to 36 months. The rolling adjuster would be computed in advance and announced on or before the 23rd of the month 12 months in advance of its application (i.e., January 2023 rolling adjuster would have been announced on or before Dec. 23, 2021).
ESL milk currently makes up approximately 8%-10% of the fluid milk market. USDA estimated the final ESL adjustor for each month in 2023, which, on average, increased the Class I milk price for ESL milk by 40 cents/cwt. The range of the adjustor varied widely with a hypothetical 95-cent reduction to Class I ESL milk in August 2023 and $1.18 increase to Class I ESL milk in April of2023. The proposed adjustor adds increased complexity to an already intricate system and may not stabilize the price of ESL milk as intended. In addition, this complicated nuisance would be made completely irrelevant if futures and options contracts for Class I milk were to be introduced. These would provide risk management opportunities for everyone in the market, not just ESL processors.
5. Class I Differentials
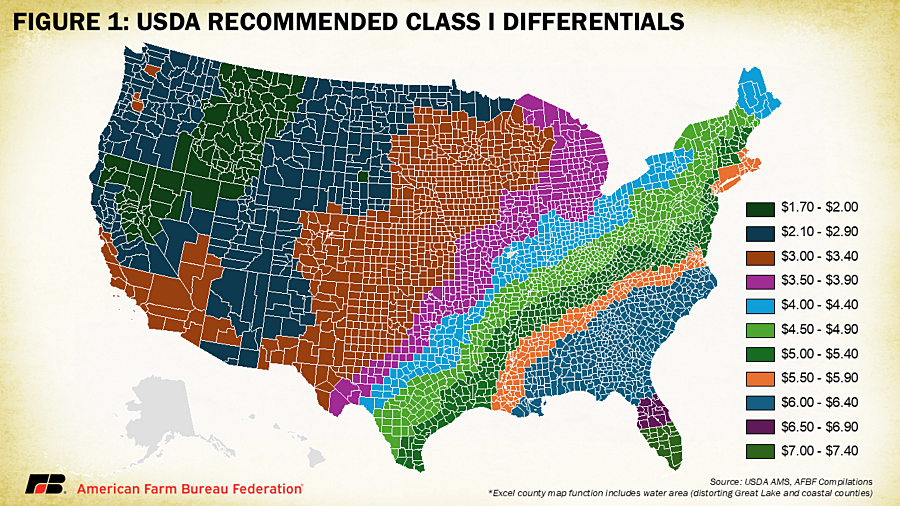
Class I differentials are a key part of the pricing formula for Class I beverage milk in the U.S. These differentials are fixed values, currently ranging from $1.60 to $6 per hundredweight, and are assigned to each U.S. county based on the region's milk supply and demand characteristics. The purpose of these differentials is to account for the perishability of milk and the cost of moving it from where it is to where it is needed to supply Class I markets, because the cows and the people aren’t always in the same place. For a deep dive into Class I differentials please refer to: Milk Price Differentials Long Overdue for an Update.
The current Class I differentials were established in 1998 with a 2008 update limited to the Appalachian, Florida and Southeast markets. The rising costs of hauling milk, including higher fuel prices, increased driver wages and other transportation expenses, mean that current differentials no longer reflect the actual cost of supplying milk to processing plants, leading to inequities in milk pricing.
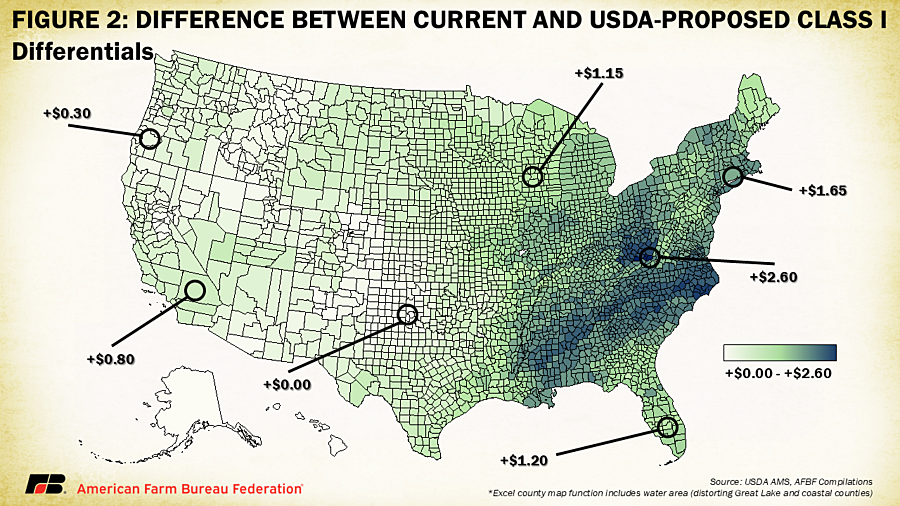
USDA’s recommended decision proposes increases to all Class I differentials, except for two counties in southwest Oklahoma (Greer and Harmon counties’ Class I differentials are recommended to stay at $2.60). The largest increases are proposed in three West Virginia counties (Monroe, Summers and Wyoming) with a recommendation to lift their current $2.20 differential to $4.80. USDA’s proposal would lift Class I differentials the most in the Southeast order, Appalachian order, southern Mideast order and the Northeast order. Orders in the West would see smaller increases (Figure 2). On average, Class I differentials would be lifted by $1.25 across the country, with the highest average increase in the Appalachian order (+$1.87) and lowest increase in the Arizona order (+$0.35).
These adjustments are overdue, and we trust that USDA, by beginning with the results of a relatively unbiased economic model, has largely captured the relative location value of milk across the country.
Putting it All Together
One of the key elements of the FMMO system is its pooling mechanism, which ensures that farmers receive a uniform price for their milk, regardless of what it is used for. The intention is to ensure handlers in a similar location and who produce similar products pay the same minimum classified price for the raw milk and that farmers producing milk in the same area receive the same price (i.e., uniform pricing). Each month, the total Class values of milk within an order are aggregated, and an average uniform price is calculated. The contributions of different Class prices to the pool can vary significantly depending on the supply and demand conditions within an order. Consequently, the effects of adjustments to Class price formulas on individual orders are best understood once differences in Class utilization and production volumes are accounted for.
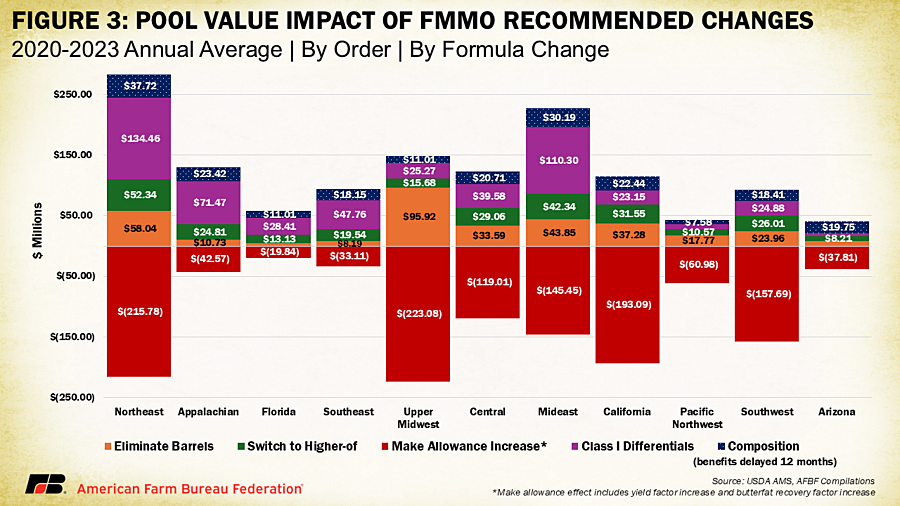
Figure 3 illustrates the annual impact of each of USDA's recommended amendments on the total pool value for each order (using an average across 2020-2023 pricing data). In this analysis, each adjustment was made separately and then layered to isolate the effect of each recommendation. However, it's important to note that interactions between different formula factors within the Class price equations were not considered, so the combined effects of these adjustments in real-world scenarios might differ.
Most apparent, the proposed increases in make allowances have significant negative impacts to order pool values, ranging from a pool value impact of -$19.84 million in the Florida order to -$223 million in the Upper Midwest order. All other adjustments positively impact pool values. Composition factor updates contributed to a one-year increase of $220 million across all orders, a benefit that would be inaccessible for the first year due to the proposed implementation delay. The proposed ESL adjustment for the base Class I price was not included as the overall impact on pool values was too minor to visualize.
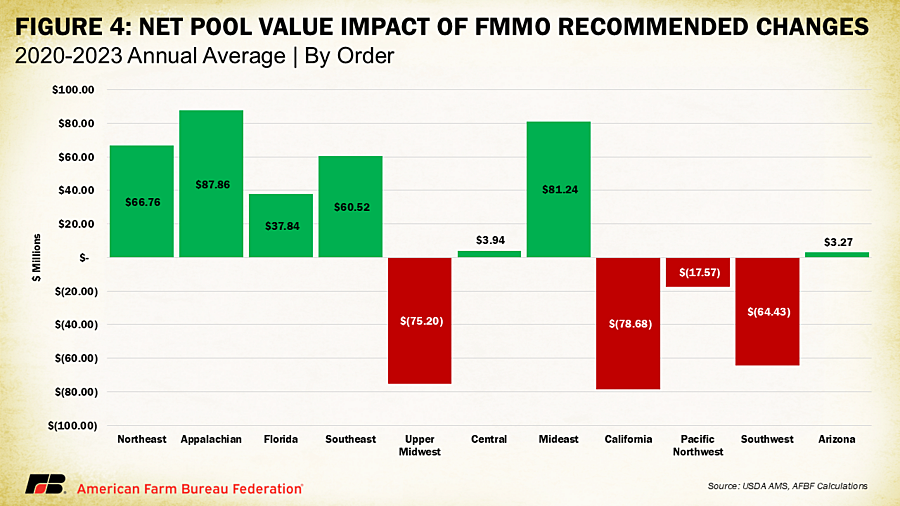
Figure 4 combines the effects of USDA’s FMMO recommendations and shows the net impact on each order. The proposed increases in make allowances would significantly offset the benefits in several orders, reducing the total pool value by $78 million in the California order, $75 million in the Upper Midwest order, $64 million in the Southwest order, and $17 million in the Pacific Northwest order. If these changes had been implemented in 2020 through 2023, dairy farmers in these four orders would have received lower prices than under the current FMMO system. These orders have higher Class III and IV utilization, making them more vulnerable to the negative effects of increased make allowances. In contrast, orders with higher Class I utilization, such as the Appalachian and Mideast orders, would see an increase in pool value from the proposed changes. Arizona and the Central orders would experience a small but positive benefit. The proposed make allowance increases create disparities among dairy farmers based on their physical location — an outcome that the FMMO system is designed to prevent.
What’s Missing?
AFBF supported some other changes that USDA hasn’t recommended. Those include a higher minimum Class I differential, in line with the higher cost of supplying Grade A milk; the elimination of advanced pricing for Class I milk and for Class II skim milk, which would reduce the misalignment of prices each month and so reduced the risk of depooling; adding 640-lb. cheddar blocks to the survey, to make the price collection more robust as the larger blocks are gradually replacing the 40-lb. blocks; adding unsalted butter to the survey, to make that price collection more robust as that volume grows and unsalted butter is increasingly seen as a production substitute for salted butter; and an 86 cent increase in the Class II differential, an updated based on the exact logic that USDA applied when they first established the Class II differential 25 years ago.
Rulemaking Process
The release of the recommended decisions marks the ninth step in the 12-step FMMO rulemaking process. At this stage, stakeholders and the public are invited to voice their opinions and concerns about USDA’s proposals, with the comment period open until Sept. 13. Comments can be submitted here. Following the comment period, USDA will spend the next 60 days reviewing and analyzing the feedback before issuing a final rule, anticipated around mid-November. Once the final rule is published, USDA will organize a referendum, allowing dairy farmers and cooperatives to vote on whether to accept or reject the proposed amendments within each order, ultimately determining the future of the FMMO system.
Conclusion
USDA’s proposed amendments to the 11 Federal Milk Marketing Orders carry potential benefits for many dairy farmers and significant concerns for others. While a switch back to the “higher-of” Class I base price, elimination of the barrel cheese price, and increases in composition factors and Class I differentials are designed to better reflect current market realities and improve overall pricing for farmers, the recommended make allowance increases is so large that it would wipe out these gains, particularly in regions with high Class III and IV utilization. They also raise concerns about creating regional disparities among dairy farmers.
The delay in implementing composition factor updates and the added complexity of the ESL milk adjuster further complicate the potential outcomes, leaving many dairy farmers uncertain about whether the changes will ultimately work in their favor.
Top Issues
VIEW ALL

