Farm Bankruptcies Down… For Now

Samantha Ayoub
Associate Economist
Chapter 12 Bankruptcy provides family farmers with flexibility to carry on normal business operations while making reasonable payments towards their debt load, even when facing the risk and uncertainty of agricultural production. The measure was introduced into law as a temporary measure in 1986 but became permanent in 2005 due to its success streamlining the filing process and addressing the large debts of farming operations. AFBF Market Intel reports have long followed the annual filings of Chapter 12 bankruptcies nationwide as an indicator of farm financial health.
The good news for 2023 is that farm bankruptcies have once again reached a record low since Chapter 12 became permanent. Coming off a year of record-high commodity prices and subsequently high net farm incomes in 2022, overall farm loan delinquency rates also dropped in 2023. According to the U.S. Courts, 139 farm bankruptcies were filed in 2023, down 18% from 2022. This continues a four-year decline since the decade high of 599 filings in 2019. Unfortunately, this downward trend in farm bankruptcies is unlikely to continue.

Farm finances are a dark spot right now. The total number of farms in the U.S. declined by over 140,000 between the 2017 and 2022 Census of Agriculture. Five thousand more farms were lost from 2022 to 2023. Bankruptcy filings do not represent this long-term trend of farm closures and consolidation. Additionally, in February, net farm income for 2024 was projected to be down nearly 40% from 2022, and many key commodity price expectations have fallen further since then. The government safety net that normally supports farmers when markets hit bottom is currently undermined by inflation and an outdated 2018 farm bill. So, just because Chapter 12 farm bankruptcies have been falling in recent years does not mean farms are not facing devastating financial struggles now.
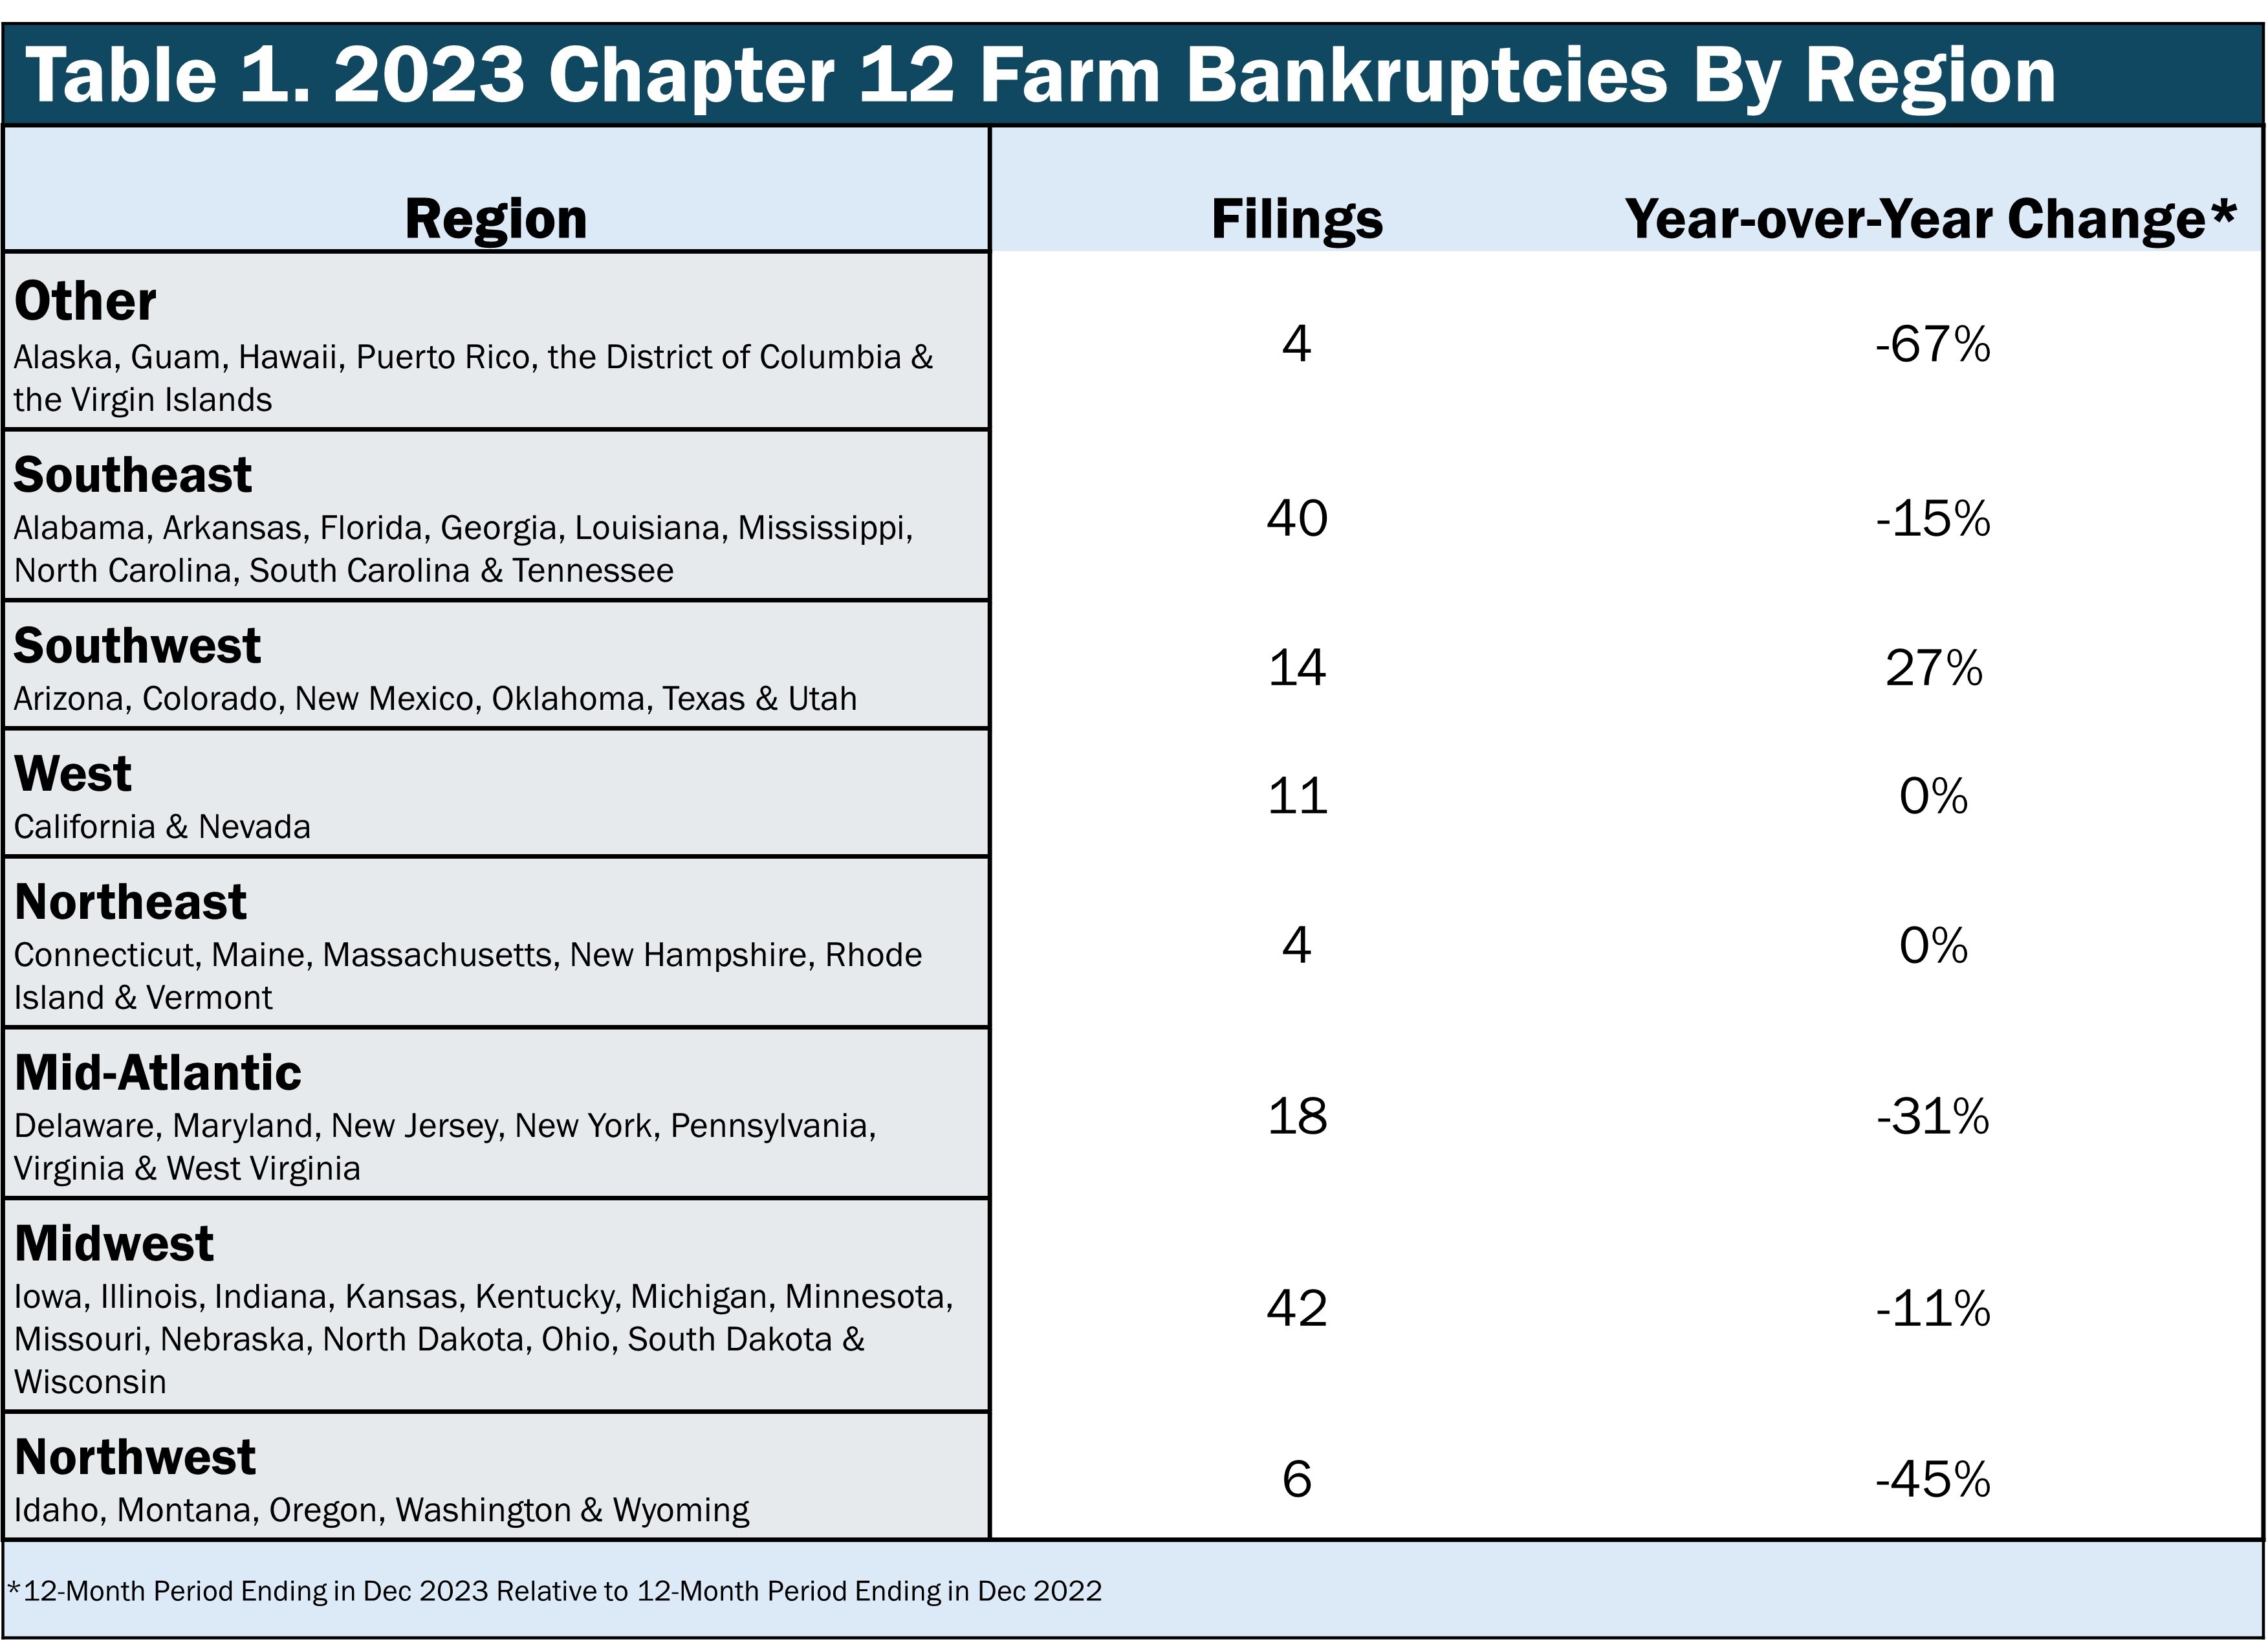
Chapter 12 Bankruptcies by Region
Most regions had decreases in bankruptcy filings last year. After more than doubling in 2022, there were only four filings in territories and states outside the lower 48 – designated “Other” by the U.S. Courts – which was 67% less in 2023 than 2022, making it the largest decrease of any region. Other regions that had double-digit percentage decreases in Chapter 12 filings were the Northwest, mid-Atlantic, Midwest and Southeast. The Midwest and Southeast had the most filings of any regions with 42 and 40 filings, respectively. Both the Northeast and West saw no change from 2022 to 2023, but the Northeast tied for the least number of filings compared to the West’s 11 filings.
Only one region had an increase in filings in 2023: the Southwest (Texas, Oklahoma, New Mexico, Arizona, Utah and Colorado). The region had three more cases filed than in 2022 for 14 total Chapter 12 filings in 2023. This region was hit hard by extreme drought in 2022, reducing harvest yields, which led to continued planting and market uncertainty in 2023.
Chapter 12 Bankruptcies by State
On a state level, the total number of bankruptcies widely varies, as shown in Figure 3. While 17 states/territories had no bankruptcies, some states had as many as 11 cases filed.

Twelve states had no filings in 2023: Alaska, Alabama, Connecticut, Hawaii, New Hampshire, New Mexico, Nevada, Rhode Island, Utah, Vermont, West Virgina and Wyoming. While some of these states have a recent history of zero filings – Nevada has not had a filing in 10 years – this is a first for others. 2023 is the first time Alabama and Michigan have not had a filing since Chapter 12 became permanent in 2005.
Twenty states had decreases in filings in 2023. As seen in Figure 4, nearly three-quarters of all states and territories had decreases or no changes in their filings. New York had the largest decrease in cases with nine cases – seven less than 2022.
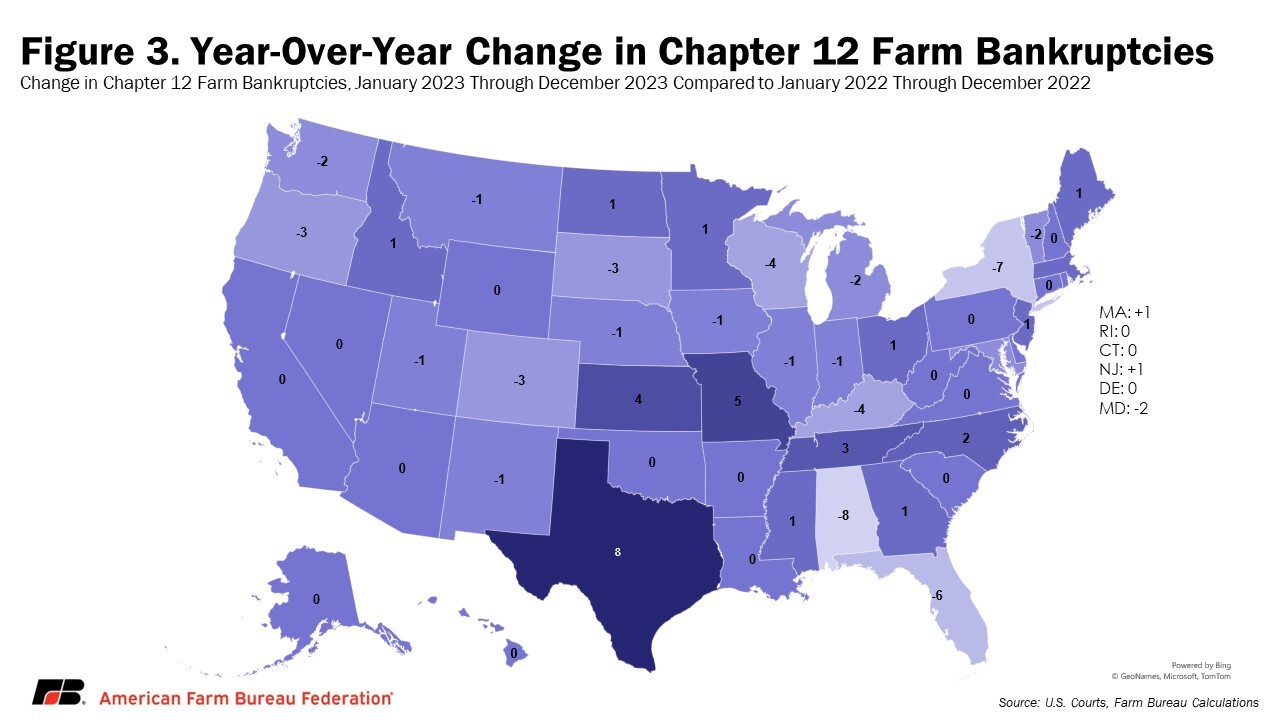
In less fortunate circumstances, 14 states had increases in 2023 filings. Texas had the largest increase in filings with 10 cases – eight more than 2022. Three other states had a double-digit number of filings: California (11), Georgia (11) and Kansas (10). Of the 14 states with increased cases, nine increased by only one case (Georgia, Idaho, Massachusetts, Maine, Minnesota, Mississippi, North Dakota, New Jersey and Ohio). The other states that had increases include Missouri (six, up from one), North Carolina (six, up from four) and Tennessee (four, up from one).
The Future of Farm Financials
Chapter 12 farm bankruptcies in 2023 fell to a record low since the program was made permanent, but this year, farmers face decreased revenues and higher costs. As a result, we are likely going to see increased filings in 2024 and beyond.
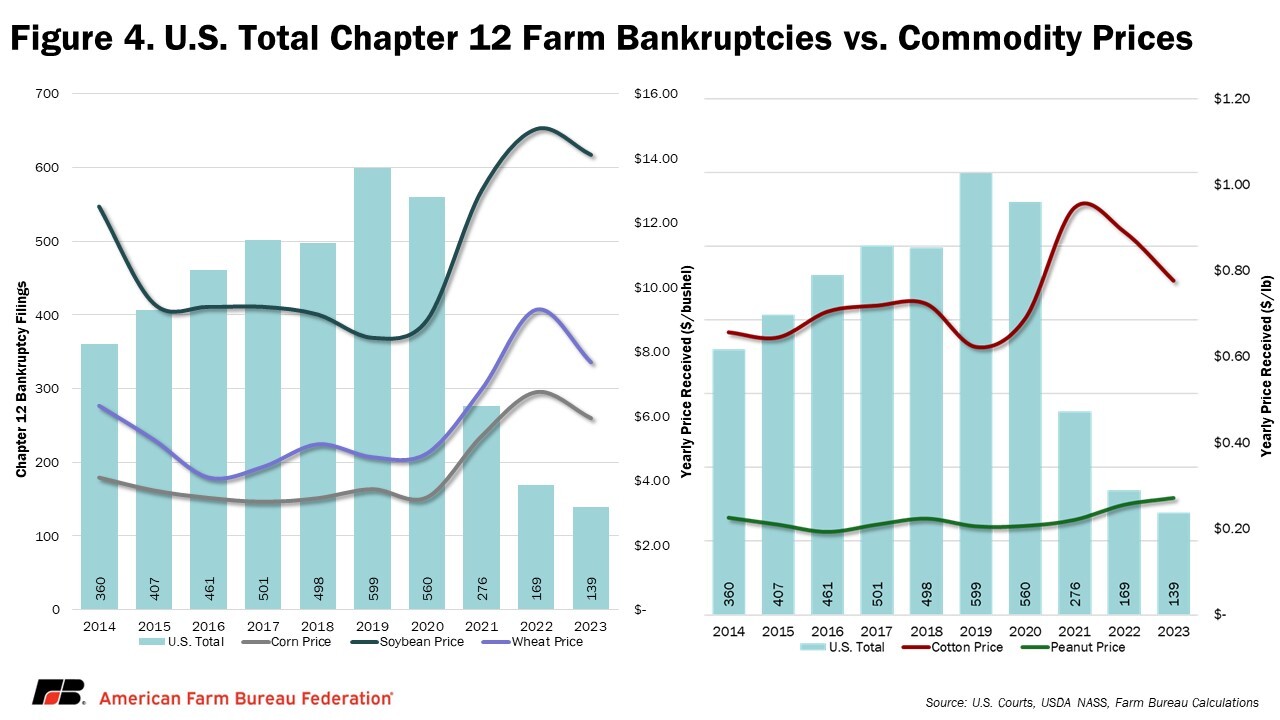
After record-high grain prices and farm incomes in 2022, 2023 net farm income (farm income minus expenses) is forecast at only $155 billion, down from $185.5 billion in 2022. This was still high enough to lead to another decline in farm loan delinquency rates in 2023. However, a drop in 2023 grain prices (Figure 5) is expected to continue into 2024. USDA estimated that 2024 net farm income would be $43 billion lower than 2023 when adjusted for inflation, and this estimate is derived from the initial February commodity outlooks for the 2024/2025 marketing year. Since the report in February, the price outlook for all major grains has continued to worsen due to increased supply expectations from favorable growing conditions nationwide and historically high on-farm stocks. The price for corn was initially forecast at $4.40 per bushel in the February outlook, but the July World Agricultural Supply and Demand Estimates report lowered that to $4.30 per bushel. Likewise, soybean and wheat price outlooks are down 10 cents and 30 cents per bushel, respectively, between the two reports. Cotton prices fell 12 cents per pound from February to March after an unexpected 9% increase in acres planted from the March Prospective Plantings report to the final June Acreage survey. As a result, the $21-billion drop in farm cash receipts for crop and livestock sales in 2024 that USDA expected in February is now likely to be even greater.
Another element of the farm financial struggle is production expenses that continue to increase to record highs for the fourth consecutive year. In the February net farm income forecast, production expenses were expected to increase $17 billion. The Purdue University-CME Group Ag Economy Barometer has recorded higher input costs as farmers’ biggest concern for their farming operation for many years. Looking to the future, USDA forecasts that total production costs will continue to increase into 2025 for all major field crops except cotton (corn, soybeans, wheat, rice, peanuts, sorghum, oats and barley). To accommodate these costs, it is crucial that farmers have access to capital. Agricultural debt nationwide increased in 2023 due to growing demand for production loans to cover surging supply costs. However, farm capital investment is approaching record lows, according to the Perdue University-CME Group Ag Economy Barometer’s Farm Investment Index. That same report has shown growing concern for interest rates’ impact on long term farm well-being.
According to data from the Kansas City Federal Reserve, farm debt at commercial banks reached over $744 billion in 2023, up from $709 billion in 2022. Much of this debt has been made more expensive after 11 interest rate increases by the Federal Reserve between March 2022 and January 2024. So, farmers have been hit by both the inflation that increased many of their costs and the interest rate hikes that have been aimed at curbing that inflation. Those rate increases have led to a 43% increase in aggregate U.S. farm interest expenses from 2022 to 2023. The elevated interest expenses are expected to continue into 2024, remaining 73% higher than 2018, when the last farm bill was passed. The double-edged sword of inflation and the interest rates that the Federal Reserve Bank is using to combat it have raised operating costs for farmers, increasing the need for credit to provide farm liquidity. Chapter 12 bankruptcies require the repayment of debt over three to five years, but farms are faced with ongoing challenges in sustaining their operation finances in the meantime to cover those payments.
Filing for bankruptcy is a last resort after all other options have been exhausted to pay back debts. Therefore, bankruptcy filing may not always be a solution for farms facing financial hardship. Many farms may choose to close before reaching the point of bankruptcy when faced with such uncertain futures for farm finances. Recent declines in the number of U.S. farms are just the latest in a trend of losses in farms and farmland beginning in 1950. Smaller farms with under $50,000 in agricultural product sales and government program payments face the highest rates of closure, likely due to the high costs of sustaining these businesses with limited farm revenue. These smaller farms are also, naturally, more reliant on off-farm income. Eighty-four percent of all U.S. farms earn the majority of their household income off-farm and use that to cover farm expenses. To be eligible for Chapter 12 filings, more than 50% of the filer’s gross income must have come from farming. As a result, many struggling farms may not even have Chapter 12 bankruptcy as an option. Meanwhile, as hope for an updated farm bill grows dimmer as we approach the Sept. 30 deadline, holes in the farm safety net continue to grow, making it even more difficult for farmers to manage risk in their operations.
Farmers are relying on the 2018 farm bill, written and passed in an era of stable prices, to serve as support against the uncertainty of the current market. That farm bill operated through six years of market volatility, a global pandemic and exceptional price inflation that was not adequately addressed by many of the farm bill’s programs. The 2018 farm bill, still in place in 2024 under a 12-month extension, is based on outdated reference prices that lower the safety net to the financial floor and offer very little protection against bankruptcy. When production is affected to the point that farm revenues fall, USDA, through the Agriculture Risk Coverage (ARC) or Price Loss Coverage (PLC) programs, issues payments to covered commodities based off historical yield levels and reference prices -- minimum market prices – on a farm’s base acreage. However, base acreage – the crop-specific acres a farm has eligible for farm bill programs – registered after the 2018 farm bill is 21 million acres lower than the actual acreage planted to program crops. This discrepancy undermines the effectiveness of ARC’s risk management benefits. The reference prices that trigger PLC payments are based off a price escalator that has not kept up with inflation or input price increases. Farms continue to face lower income from the dropping commodity prices that are leading to farm losses, but – for many farmers – with no support from outdated farm bill provisions, we may be facing a near future of heightened farm financial hardships.
Conclusion
It has been encouraging to see four straight years of fewer Chapter 12 filings. This shows the fundamental long-term viability of American farming.
Keep the greater farm financial environment in mind, though, when looking to the coming years. Rising production costs, difficulty attaining capital and falling crop prices all threaten long-term farm well-being. Farm bankruptcies are only one indicator of farm financial health. Other farm closures, sales and consolidations can also show that farms are financially struggling, short of the last resort of a Chapter 12 bankruptcy.
Farm finances will almost certainly weaken in 2024 and 2025, based on high credit costs, rising land costs and falling commodity prices. Meanwhile, the (already) six-year-old farm safety net is dangerously fraying just when it may be needed most.
