Farm Cash Receipts Forecasted to Hit a Decade-Low in 2020

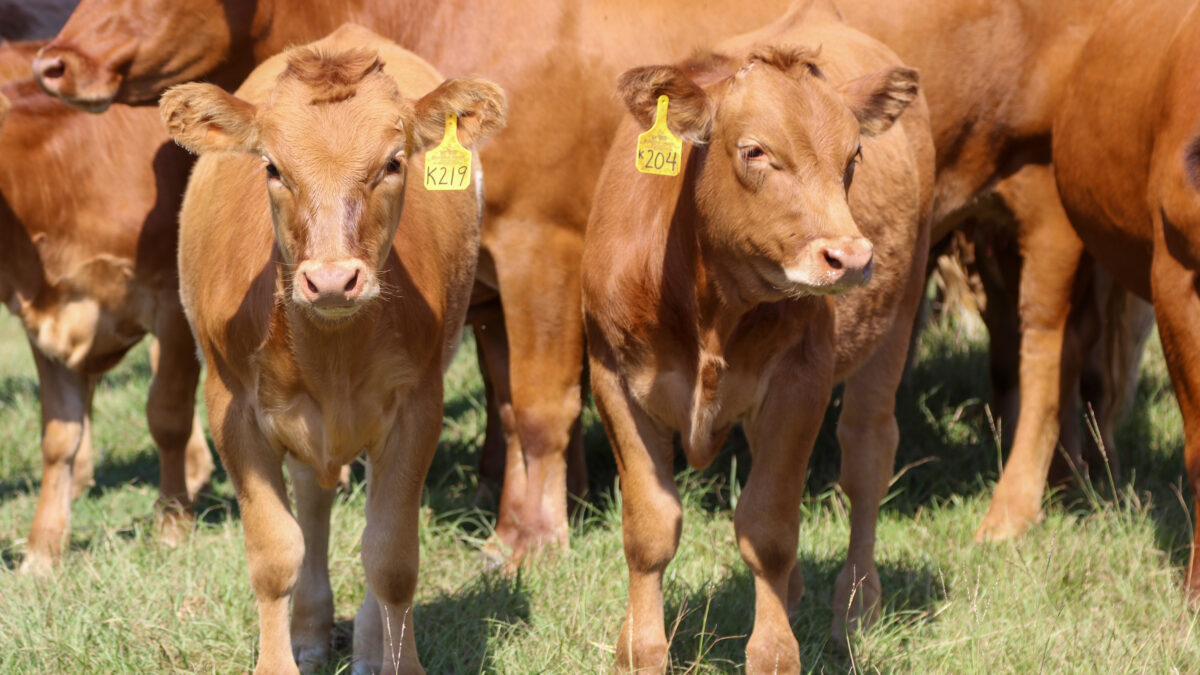
photo credit: Alabama Farmers Federation, Used with Permission
John Newton, Ph.D.
Chief Economist
Following a sharp downturn in many commodity prices following COVID-19, e.g., Coronavirus Sends Crop and Livestock Prices into a Tailspin, USDA’s most recent Farm Income Forecast, released Sept. 2, projects cash receipts from the sales of crops and livestock will decline by $12 billion, or 3%, from 2019 to $358 billion. If realized, U.S. farm cash receipts will be at the lowest level in more than a decade, and $18 billion below the 10-year average of $376 billion.
Largely through the Coronavirus Food Assistance Program and the Paycheck Protection Program, Congress and the administration have provided a projected $23.4 billion to help farmers and ranchers impacted by COVID-19. Importantly, nearly $3 out of every $4 in federal support to farmers and ranchers comes from CFAP, PPP and other ad hoc assistance programs, like the tariff-mitigating Market Facilitation Program. When this support is combined with traditional farm bill conservation and risk management programs and other farm income, total gross income is forecast at $447 billion for 2020, up 3% from 2019, but more than $36 billion below 2013 and 2014 gross income levels.
After taking into consideration a decline in total production expenses of $4.6 billion, or 3%, to $344 billion, net farm income, a broad measure of U.S. farm profitability, is projected at $103 billion for 2020, up 23% from the prior year and the highest level since 2013’s $123 billion. Removing all federal payments, net farm income in 2020 would be approximately $66 billion, slightly higher than prior-year levels, but $10 billion below the 10-year average. In short, the actual farm economy and what growers receive from the market largely remains depressed.

Cash Receipts by Commodity
USDA’s latest farm income report reflects the significant impact of COVID-19 on commodity prices and cash receipts. Cash receipts for poultry (broiler) producers are projected to decline by 23% from 2019 to $22 billion, falling to the lowest level in more than a decade. Similarly, cash receipts for hogs are projected 16% lower to $18.5 billion. Cattle and calf cash receipts are forecast to decline 8% to $61 billion, while cash receipts for dairy farmers are projected to be 2% lower at $40 billion. Overall, livestock-related cash receipts are projected to decline by $14 billion, or 8%, from 2019.
For crops, corn, soybeans, wheat and cotton are all projected to post lower cash receipts in 2020. With a decline in cash receipts of $3 billion, or 6%, from 2019, corn producers are expected to have the largest dollar decline. Driven by higher expected prices, specialty crop cash receipts are forecast to increase by 17% in 2020 -- one of the few agricultural sectors with higher expected cash receipts. Figure 2 highlights the year-over-year percentage change in cash receipts by commodity.

Other Farm Financial Indicators
During 2020, U.S. farm sector debt is projected to increase $15 billion, or nearly 4%, to a record $434 billion. Nearly 65% of farm debt is in the form of real estate debt. Real estate debt is projected to increase $14.7 billion to a record-high $282 billion. Non-real estate debt is projected to increase only slightly to $152 billion. Farm assets, including farmland, animals, machinery and vehicles and crops in inventory, are projected at $3.1 trillion, $33 billion higher than 2019. Most of this increase, $29 billion, is related to higher farmland values.
Based on 2020 debt and asset levels, the debt-to-asset ratio is projected at nearly 14% for 2020, which would be the highest since 2002. Every year since 2012, debt-to-asset levels have climbed higher.
Working capital, which takes into consideration current assets and liabilities, is the amount of cash and cash-convertible assets minus amounts due to creditors within 12 months. In 2020 it is projected to fall by $10 billion, or nearly 13%, to $68 billion. Current working capital levels have declined sharply in recent years and now stand 43% below 2012’s level of $121 billion and are 55% lower than 2010’s $153 billion. The low level of working capital suggests that many U.S. farmers have just enough capital to service their short-term debt.
Another metric that highlights the downturn in the farm economy and low profitability is the rate of return on assets. For 2020, the rate of return on assets is projected at less than 3%. The rate of return in agriculture has been less than 3% for three consecutive years and is in stark contrast to the 10%-to-16% returns experienced from 2010 to 2012. Figure 3 highlights U.S. farm sector debt, the debt-to-asset ratio and the rate of return on farm assets.

Summary
While the headlines would suggest the farm economy is improving, the opposite is true. The actual farm economy remains depressed, and without the ad hoc support from Congress and the administration, farmers, ranchers, rural communities and the businesses they support would be in an even worse financial position.
Farm income from the sales of crops and livestock have fallen by $12 billion since last year. Nearly every major sector of the farm economy will have lower cash receipts this year compared to last year, and total cash receipts will be the lowest since 2010. Moreover, farm debt and debt-to-asset levels continue to climb, while working capital levels deteriorate further and the rate of return on farm assets remains thin.
Lower production costs alongside federal assistance via CFAP, MFP, PPP and other ad hoc support temporarily help offset the impact of lower commodity prices and revenue. Longer term – beyond additional stimulus likely to come from Congress and the administration – U.S. farm income will be critically dependent on maintaining international market access and remaining competitive around the world, restoring demand for renewable fuels and finding innovative ways to generate revenue for farmers’ conservation and sustainability efforts.