Farmers Caught in Crossfire of Chinese Ship Fee Fight

Daniel Munch
Economist
With more than 20% of U.S. agricultural production destined for foreign markets, exports are critical to the financial success of American farmers and ranchers. In 2024, U.S. farmers exported over 144 million metric tons of agricultural products, valued at more than $105 billion, through ocean ports. These ocean shipments represented nearly 60% of total agricultural export value and 65% by volume, underscoring the vital role of maritime transport in delivering U.S. agriculture to global customers. However, recent proposals to impose substantial fees on Chinese-built and -operated vessels entering U.S. ports could have far-reaching consequences for agricultural trade.
Proposed Fees on Chinese-Built and -Operated Vessels
The Trump administration has proposed a series of fees targeting ocean carriers with ties to China. These fees are part of broader efforts to counter China’s growing dominance in global shipbuilding and logistics, while attempting to stimulate U.S. shipbuilding capacity. The proposal includes:
- Fees up to $1 million per entrance on Chinese-operated vessels.
- Fees up to $1.5 million on Chinese-built vessels, scaled based on the percentage of an operator’s fleet built in China.
- Additional fees on operators with future orders placed with Chinese shipyards.
- A gradual requirement to shift a growing percentage of U.S. exports onto U.S.-flagged and U.S.-built vessels.
The U.S. Trade Representative’s (USTR) office argues these measures are necessary to counteract China’s unreasonable targeting of the maritime, logistics and shipbuilding sectors for dominance. The concern is that China's monopolization reduces competition, displaces foreign firms and increases dependencies on Chinese supply chains. The fee proposals are currently open for public comment until March 24, with a public hearing scheduled on the same day. Following the hearing and review of public feedback, USTR will decide on how to implement the proposed measures.
Potential Impacts on U.S. Agriculture
While addressing China’s maritime dominance is a valid national security concern, these proposals may unintentionally – and disproportionally – penalize U.S. farmers and ranchers who rely on affordable and efficient shipping. Over 21% of all vessels calling at U.S. ports in 2024 were Chinese-built, meaning a substantial share of vessels transporting U.S. goods — including agricultural products — could be subject to these fees.
Bulk agricultural exports, particularly grains and oilseeds, are especially vulnerable. In 2024, the U.S. exported over 106 million metric tons of bulk agricultural products. Assuming an average vessel capacity of 60,000 metric tons, approximately 1,770 vessel movements per year support these exports. Applying the 21% figure for Chinese-built vessels translates to about 372 vessel trips per year facing the proposed fees.
Many dry bulk vessels arriving at U.S. ports from China often come partially loaded or even empty, since China’s primary exports to the U.S. are manufactured goods typically shipped in container vessels. Once in the U.S., these bulk carriers are essential to agriculture, frequently loaded with grains, oilseeds, and other commodities for export.
Container ships, by contrast, typically arrive in the U.S. full and return to China empty or lightly loaded. This is why container shipping rates are much higher from Asia to the U.S. than in the reverse direction — importers bear most of those costs on the inbound leg.
For bulk carriers, the opposite is true: they may arrive empty but leave full with U.S. agricultural products. That means U.S. exporters, particularly farmers, are more exposed to any added vessel fees, since they rely on filling those ships for outbound sales. In effect, while container shipping fees weigh more heavily on U.S. importers, dry bulk shipping fees fall squarely on U.S. exporters — leaving farmers to absorb the brunt of higher transportation costs.
Depending on whether the $1 million fee on Chinese-operated vessels, the $1.5 million fee on Chinese-built vessels, or both cumulative fees are applied, bulk agricultural exporters could face an additional $372 million to $930 million in annual transportation costs. On a per-unit basis, these compounded fees translate to an increase of 9.5 to 27.75 cents per bushel of soybeans — representing a substantial margin loss in global markets where competitiveness is often determined by mere pennies per bushel.
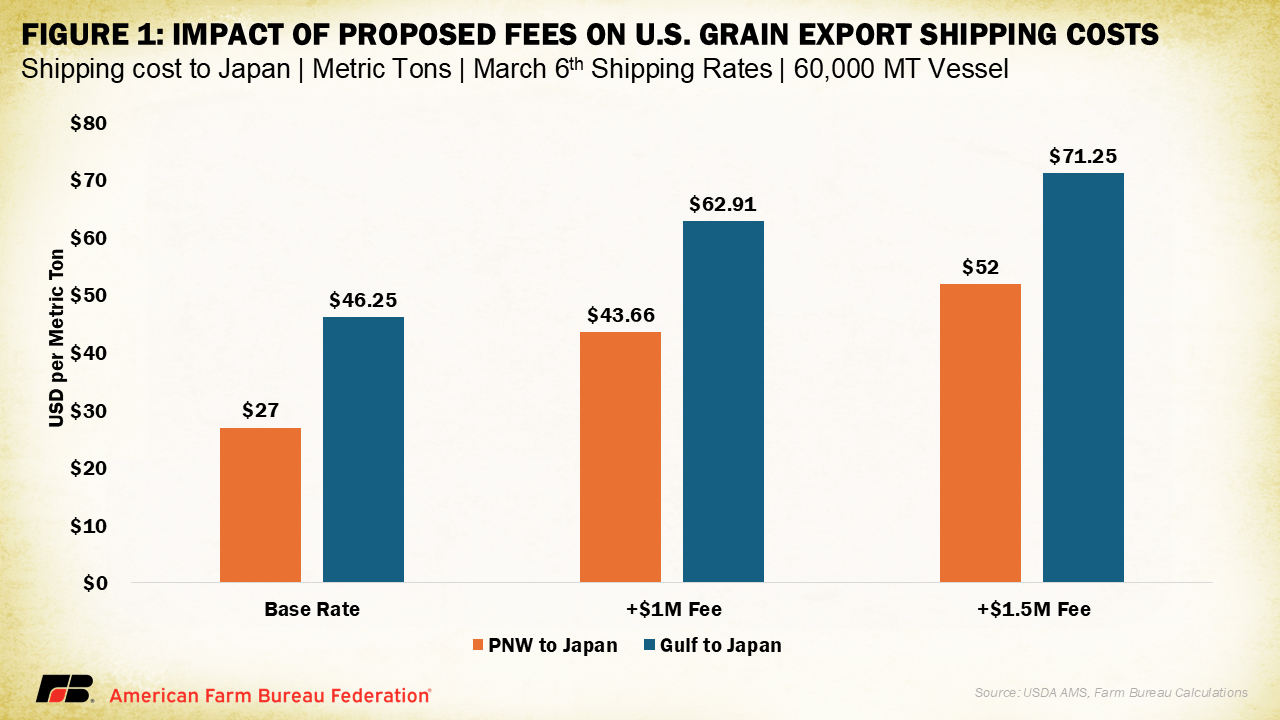
For example, as of March 6,the rate for shipping grain from the U.S. Gulf to Japan was $46.25 per metric ton. From the Pacific Northwest, the rate stood at $27 per metric ton. On a ship holding 60,000 metric tons, a $1 million fee would increase these rates to $62.91 and $43.66 per metric ton, respectively. A $1.5 million fee would push them further, to $71.25 and $52 per metric ton respectively. Such increases will make U.S. products less competitive on the global market and most of this would be passed back to farmers through lower prices or widened basis levels.
Containerized agricultural exports, which account for around 30% of U.S. waterborne ag exports by volume, would not feel the same level of direct impact. The World Shipping Council estimates the proposed fees could add $600 to $800 per container, but because container ships often arrive in the U.S. full and return to Asia empty, these costs are expected to fall more heavily on imports. However, many U.S. farmers and ranchers rely on imported inputs — such as fertilizer, feed ingredients, machinery and specialty crop supplies — that can be transported in containers. Higher container shipping costs could therefore raise input prices, squeezing producers’ margins. If carriers pass additional charges onto outbound containerized exports, value-added ag products like meat, dairy, processed foods and specialty crops would also face rising costs.
U.S. Port Competitiveness and Timing Challenges
One component of the proposal includes a phased requirement mandating that a growing percentage of U.S. exports be transported on U.S.-flagged and U.S.-built vessels. The schedule starts with 1% of exports immediately, rising to 15% after seven years, with a portion explicitly required to move on U.S.-built ships. While the goal is to bolster U.S. shipbuilding and maritime capabilities, these mandates present a serious logistical challenge. Meeting them depends entirely on the capacity of U.S. shipyards to ramp up production—something the current system is ill-equipped to do.
In addition to immediate cost increases, the U.S. shipbuilding sector faces deep-rooted structural challenges that limit its ability to ramp up commercial vessel production in the near term. Unlike the sprawling, high-volume shipyards of Asia, U.S. shipyards are fewer in number, smaller in scale and primarily focused on specialized, military or Jones Act-compliant ships — not the container vessels that dominate global trade. On average, U.S. shipyards require anywhere from 18 months to over four years to complete a vessel, far outpaced by Asian shipyards, where ships are routinely built in 12 to 24 months. This disparity is fueled by several factors: U.S. yards have significantly higher labor costs, lower levels of automation and fragmented supply chains. Many U.S. facilities still rely on outdated production methods, lacking the modular, highly automated processes common in South Korean, Chinese or Japanese yards. Compounding the issue are rigid union contracts that have, over time, constrained modernization efforts.
Meanwhile, countries like China, South Korea and Vietnam not only benefit from government subsidies, tax breaks and low-interest financing for shipbuilding, but also from their proximity to steel producers, engine manufacturers and component suppliers, further reducing construction timelines and costs. Their large, specialized workforce provides an additional edge, making their shipyards the go-to for global shipping companies looking for faster turnaround and lower prices. Even if the U.S. introduced new incentives today, expanding domestic shipbuilding capacity to rival these competitors would be a multiyear endeavor — years in which American farmers could face persistently higher shipping costs and reduced export competitiveness.
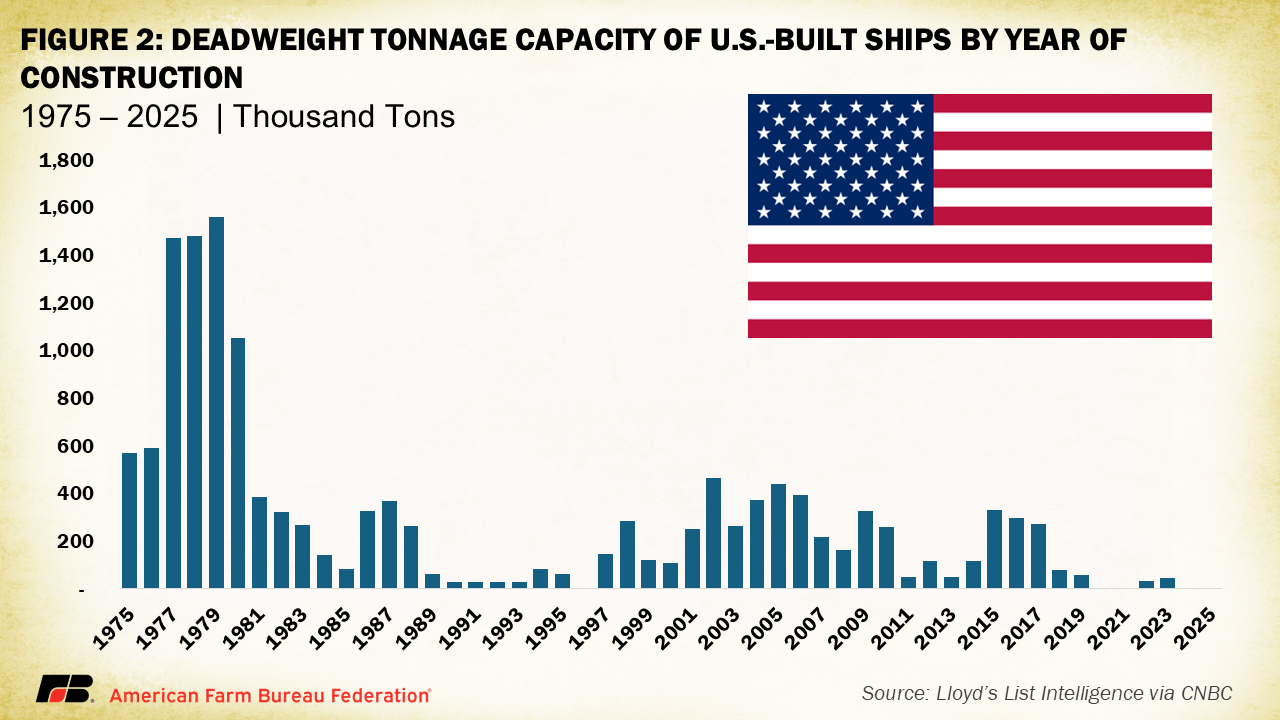
This reality is underscored by long-term data on U.S. shipbuilding output. Figure 2 illustrates the annual deadweight tonnage — a measure of how much weight a ship can safely carry, including cargo, fuel, passengers, crew and supplies — added by U.S. shipbuilders since 1975. Within this range, in 1979, U.S. yards peaked by adding 1.59 million tons of new deadweight capacity. However, production has nearly collapsed. U.S. shipyards added zero deadweight tonnage in three of the last five years and less than 50,000 tons in the other two. At this point there is simply not enough active U.S. construction capacity available to replace Chinese-built ships without severely disrupting trade.
This is particularly concerning given the vast imbalance in global fleet ownership. China controls a global fleet of more than 5,500 commercial vessels used for trade, while the U.S. controls around 100. Adding to this, approximately 70% of Chinese-owned vessels are registered under the Chinese flag, whereas only about 43% of the U.S. fleet sails under the U.S. flag. This stark disparity means the U.S. lacks both the fleet scale and control to mitigate near-term shipping disruptions.
The bottlenecks don’t stop at shipyards. U.S. port performance is another glaring weak link in the logistics chain. According to the World Bank’s 2023 Container Port Performance Index, foreign ports consistently outperform U.S. ports. Not a single U.S. port cracks the top 50 globally, while six U.S. ports fall into the bottom 50 out of 405 evaluated worldwide. Ports in countries like China, Oman, Colombia and Vietnam routinely surpass U.S. ports in efficiency. Charleston, South Carolina, is the highest-ranked American port at 53rd place, while all major West Coast ports — such as Los Angeles, Long Beach and Oakland — as well as Houston and Savannah, languish in the bottom 100. Despite the billions invested in infrastructure, U.S. ports struggle with long vessel turnaround times and outdated processes.
Global Competitiveness and Supply Chain Dependencies
The competitive disadvantage for U.S. farmers is exacerbated by the fact that major agricultural competitors such as Brazil and Argentina would not be subject to similar fees. Higher transportation costs could shift buyer preferences toward lower-cost producers. Additionally, China remains a top importer of U.S. soybeans and other products. Additional retaliatory tariffs or restrictions could further harm U.S. market access.
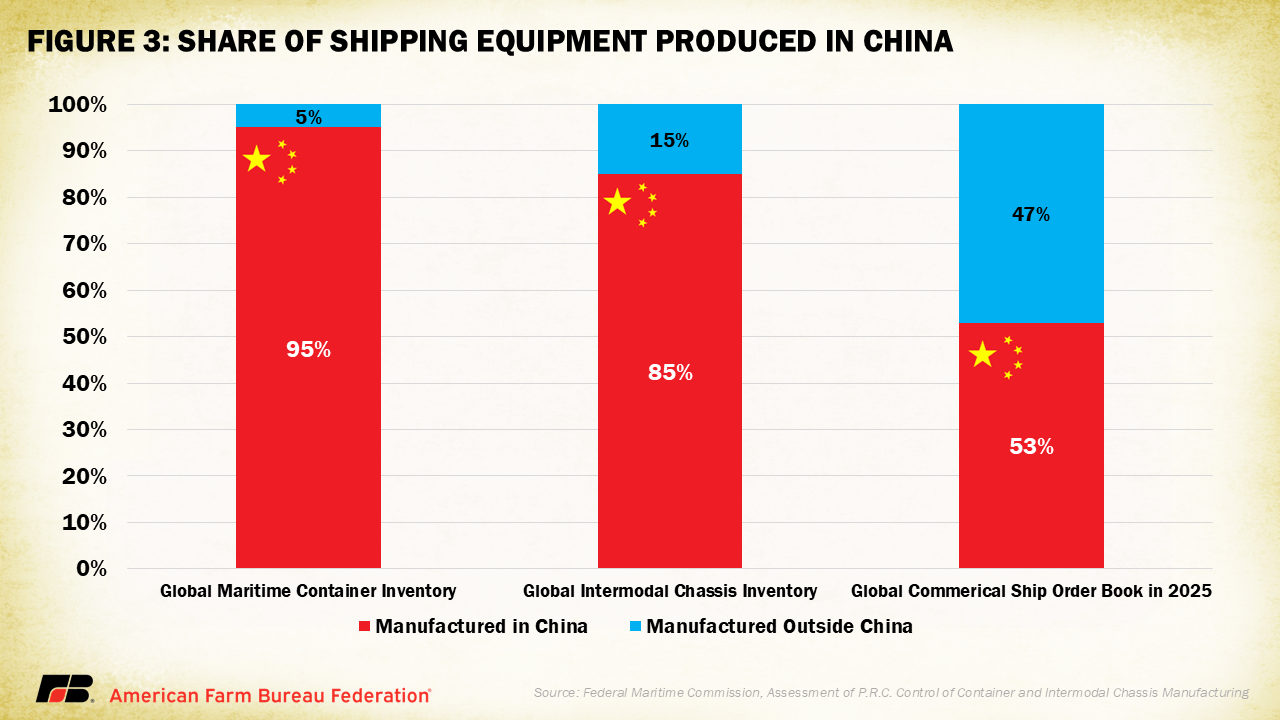
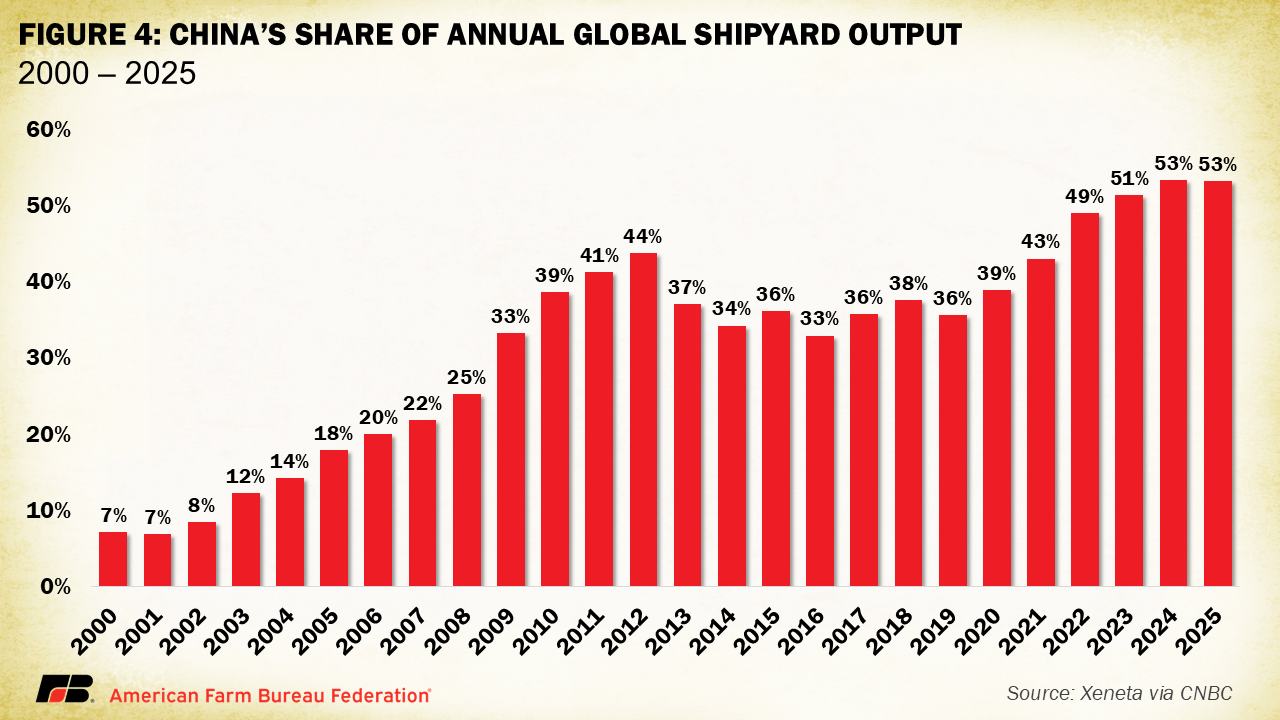
Moreover, the broader global shipping ecosystem is heavily influenced by Chinese production. Chinese firms control 95% of global maritime container inventory production, 85% of global intermodal chassis production and 53% of the global commercial ship order book. Between 2000 and 2025, China’s share of global shipyard output surged from just 7% to over 53%, underscoring their dominance. Major carriers like MSC, Maersk, CMA CGM and Hapag Lloyd rely heavily on Chinese-built vessels.
Conclusion
Addressing China's dominance in global shipbuilding and logistics is an important policy goal, particularly given supply chain vulnerabilities and national security concerns. However, imposing fees on Chinese-built and -operated vessels could impose significant near-term costs on U.S. agriculture, and U.S.-built shipping requirements could strangle trade down the road. Farmers and ranchers, already operating on tight margins, would face higher freight rates, reduced competitiveness and potential loss of market share — all while U.S. shipbuilding capacity remains years away from scaling up.
Even before implementation, the uncertainty surrounding these proposals is already creating logistical complications for both importers and exporters who depend on reliable ocean shipping. Delays in carrier scheduling, shifts in vessel availability and rising freight premiums add risk across supply chains.
These policies, whose primary impacts would be to impose costs on Chinese ships and U.S. imports, would have the unintended consequence of seriously undermining American farmers' ability to compete in global markets.
