Foreign Footprints: Trends in U.S. Agricultural Land Ownership
Daniel Munch
Economist
Foreign ownership of U.S. agricultural land, which includes timberland, remains a widely debated and often controversial topic, fueled by concerns about the implications of foreign investments — especially those from nations viewed as adversarial to the U.S. Since our previous analysis, Foreign Investment in U.S. Ag Land – The Latest Numbers, two additional years of data — 2022 and 2023 — have become available.
This article updates the trends in foreign ownership, revealing a 1.58-million-acre increase in foreign-held agricultural land between 2022 and 2023, driven primarily by investments linked to renewable energy projects. At the same time, the data shows a decrease in acreage owned by Chinese-based entities, reflecting shifting patterns in foreign land acquisition.
Background
The Agricultural Foreign Investment Disclosure Act of 1978 (AFIDA) requires foreign entities to report purchases, sales and interests in U.S. agricultural land to USDA via Form-153 submitted to the Farm Service Agency. It defines foreign entities broadly, including individuals, companies and even foreign governments, but excludes U.S. citizens and green card holders. Non-compliance can result in fines up to 25% of the land's market value, though USDA has largely depended on voluntary self-reporting for its data.
In 2024, under heightened congressional scrutiny, USDA imposed a record $1.2 million in penalties, including $13,374 for non-filings and the remainder for late filings. While these penalties remain modest relative to USDA’s full enforcement authority, they mark progress in strengthening oversight and compliance under AFIDA.
Additionally, 2023 saw a record number of AFIDA reports filed since the program’s inception, with filings increasing by 5% compared to 2022. Of the 2,095 additional reports, 1,686 were tied to unique 2023 acquisitions, while 409 detailed transactions from prior years that likely should have been reported earlier. This surge in reporting may reflect growing public and congressional focus on foreign ownership of U.S. agricultural land.
For a deeper dive into the limitations of data collection and enforcement under AFIDA and policy considerations related to the foreign ownership topic area, see our previous analysis. Additionally, to learn more about the second key mechanism for scrutinizing foreign investments in U.S. agriculture, explore How it Works — Understanding the Committee on Foreign Investment in the United States.
Summary of Data
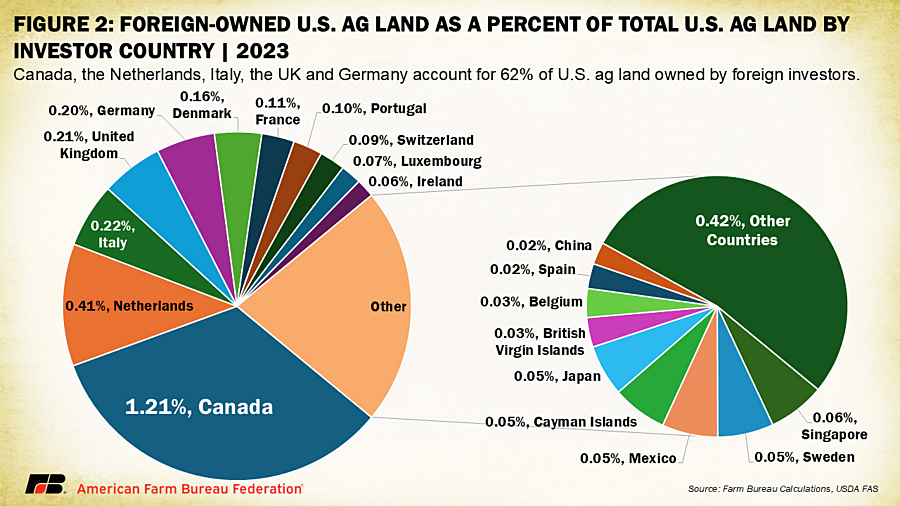
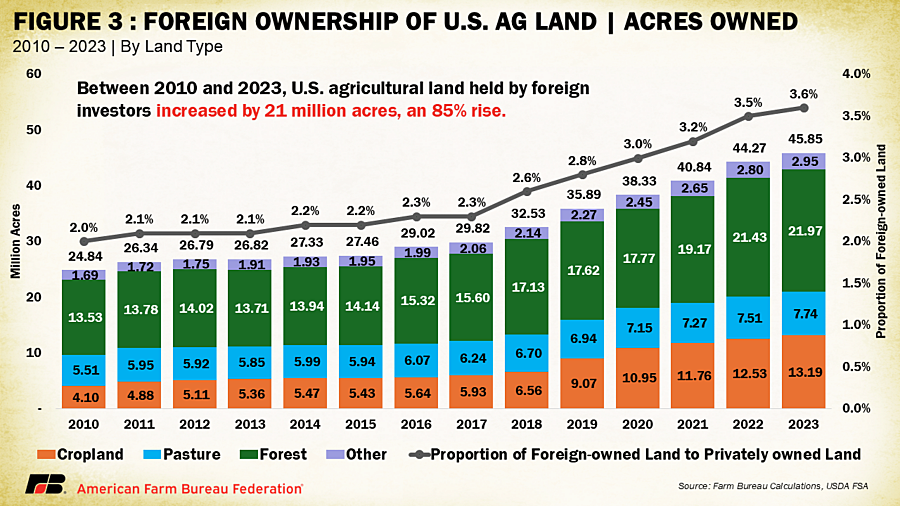
According to USDA’s latest AFIDA report, 45.85 million acres of U.S. agricultural land were held by foreign investors in 2023, which represents 3.61% of total privately held agricultural land in the United States. This marks a 1.58-million-acre (3.6%) increase from 2022 and a 5-million-acre (12.2%) rise since our prior analysis based on 2021 data. Canadian investors own the largest portion of foreign-held U.S. agricultural land with 33.5% (15.35 million acres) of the total and 1.21% of all U.S. agricultural land (Figure 1). Following Canada, investors from the Netherlands, Italy, the United Kingdom and Germany own 0.41% (5.2 million acres), 0.22% (2.7 million acres), 0.11% (2.6 million acres) and 0.20% (2.5 million acres) of U.S. agricultural land, respectively. Figure 2 further breaks down foreign-investor-held land by predominant origin nation.
Since 2010, reported foreign-held agricultural land in the U.S. has grown by 21 million acres — an 85% increase — averaging an annual gain of 1.62 million acres. This expansion, equivalent to an area larger than the state of South Carolina, has raised foreign ownership from 2% to 3.6% of all privately held agricultural land in the country. In 2023, 48% (21.9 million acres) of reported foreign-held agricultural land was forestland, 29% (13.2 million acres) was cropland, 17% (7.7 million acres) was pastureland and 6% (2.9 million acres) was other agricultural land and non-ag land, which accounts for factors like owner or worker housing and rural roads. Over the past five years (between 2018 and 2023), foreign investments in U.S. agricultural land have seen growth across all categories: a 101% increase in cropland, 28% in forestland, 15% in pastureland and 38% in other agricultural land. This reveals heightened interest by foreign investors in cropland as opposed to other land categories.
By state, Texas has the largest quantity of foreign-held U.S. agricultural land at 5.7 million acres making up 3.6% of the state’s 158 million acres of privately held agricultural land. Maine has the second-largest quantity of foreign-held U.S. agricultural land at 3.5 million acres but leads for highest proportion of foreign-held ag acreage with over 21% of the state’s 16.5 million acres of ag land being held by foreign investors. In both Texas and Maine, foreign ownership is primarily driven by forest products and timber companies. Hawai’i also has a significant share of foreign-owned agricultural land, with 17% (283,000 of its 1.6 million agricultural acres) largely tied to renewable energy investments.
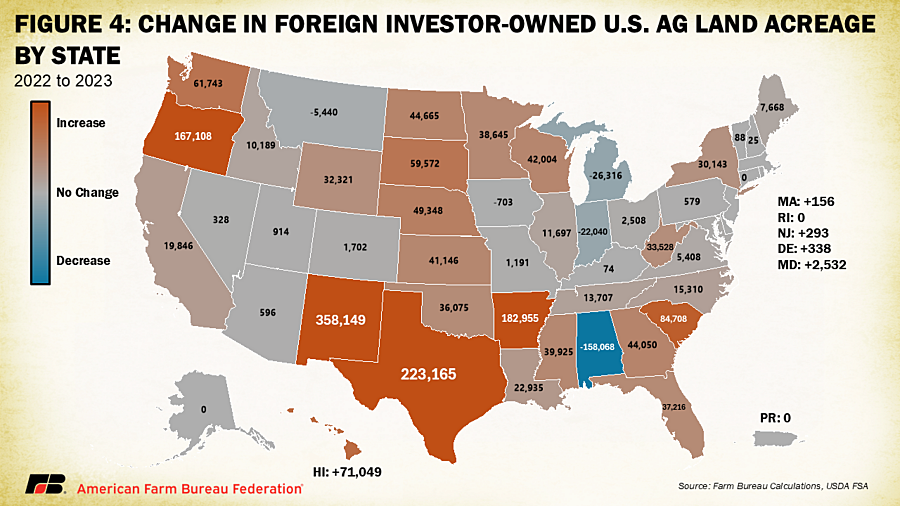
Figure 4 illustrates the change in foreign-held agricultural acreage by state from 2022 to 2023. Forty-two states saw increases in foreign-owned ag land, led by New Mexico (+358,149 acres), Texas (+223,165 acres), Arkansas (+182,955 acres), Oregon (+167,108 acres) and South Carolina (+84,708 acres). Growth in New Mexico and Texas is primarily tied to new or expanded wind energy investments, while increases in Arkansas, Oregon and South Carolina are largely linked to timber industry expansions. Hawai’i experienced the largest year-over-year percentage increase, with a 33% jump in foreign-held land, driven by wind energy projects.
Meanwhile, three states — Alaska, Connecticut and Rhode Island — along with Puerto Rico, had no change in foreign-owned acreage. Five states — Alabama, Michigan, Indiana, Montana and Iowa — experienced declines, with Alabama recording the largest numerical decrease (-158,068 acres) and percentage drop (-7%), primarily due to reduced holdings by foreign timber companies.
Renewable Energy Production Driving Foreign Investments
Under AFIDA, foreign investments in U.S. agricultural land include long-term leases of 10 years or more. This provision is particularly relevant for renewable energy companies, many of which, especially foreign entities, secure land through extended leases rather than outright purchases. This approach provides access to large tracts of land for projects like wind farms and solar arrays while minimizing the financial burden of ownership.
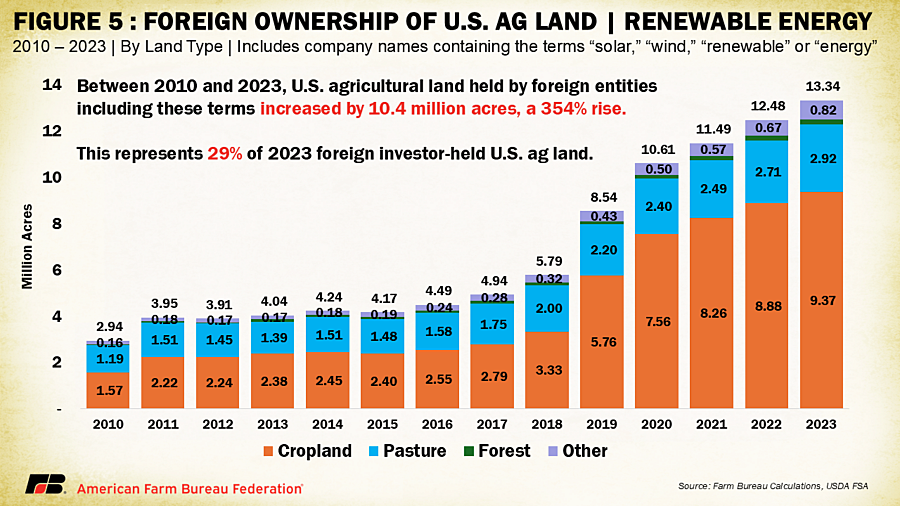
While AFIDA data does not specify the exact purpose of each foreign land acquisition, certain terms in the names of reporting entities — such as “wind,” “solar,” “energy” and “renewable” — can serve as proxies for identifying renewable energy-focused companies. This analysis estimates the extent of foreign interest in U.S. agricultural land for renewable energy development over time by aggregating the acreage associated with these terms. Canadian investors accounted for the largest share at 5.5 million acres, followed by Italian investors with 2.57 million acres and Portuguese investors with 1.2 million acres. Notably, of the top 10 nations in this category, only one — Australia — is located outside Europe, reflecting the region's commitment to renewable energy development and compliance with government mandates for carbon emissions reductions, which likely drive these investments.
In 2023, over 70% of the acreage linked to renewable energy companies was cropland, with 22% classified as pastureland, 6% as other agricultural land, and the remaining 2% as forestland. Breaking it down by keyword associations in entity names, 11.21 million acres (84%) were linked to entities containing the term "wind"; 4.8 million acres (36%) to entities with "energy"; 1.47 million acres (11%) to those with "solar"; and 404,000 acres (3%) to entities with "renewable." It is important to note that some entity names include multiple terms, leading to an overlap in these values.
Since 2010, foreign renewable energy investments in U.S. agricultural land have increased by at least 10.4 million acres — a 353% rise, accounting for nearly half of the 21-million-acre total increase in foreign-owned ag land during this period. In the past five years (2018–2023), this trend has intensified, with renewable energy entities driving 76% of the total growth in foreign-owned agricultural land, contributing 7.55 million acres out of the 9.96-million-acre increase. Between 2022 and 2023 alone, entities with renewable energy-related terms in their names accounted for 54% of the 1.58-million-acre increase. It’s important to note that these figures represent minimum estimates, as not all renewable energy companies are captured through these specific terms.
These trends highlight renewable energy investment as a major driver of the increasing foreign interest in U.S. agricultural land. The use of agricultural land for wind and solar energy production is a contentious topic, often sparking debates over whether it removes prime farmland from production or upholds landowners’ rights to use, sell or lease their property as they choose. A recent analysis, Solar Energy Expansion and its Impacts on Rural Communities, explores these topics more in depth.
As corporations face mounting pressure to meet environmental goals, investments in land for renewable energy projects are likely to continue. Many European nations, which have some of the strictest carbon offset mandates, are constrained by limited available land, driving their investors toward stable countries like the U.S., where an abundance of open land provides potential for such projects.
The National Security Factor
Concerns about foreign ownership of U.S. agricultural land often focus on nations considered adversarial to the U.S. The Bureau of Industry and Security (BIS) within the Department of Commerce plays a critical role in regulating sensitive technologies, telecommunications and supply chain security as part of national security efforts. In its most recent determination of foreign adversaries, the BIS identified the following governments or foreign non-governmental entities: The People’s Republic of China, Republic of Cuba, Islamic Republic of Iran, Democratic People’s Republic of Korea (North Korea), Russian Federation and Venezuelan politician Nicolás Maduro.
The table below highlights foreign-held acreage associated with investors from five of these nations, excluding North Korea, which holds no U.S. agricultural land. Together, these investors own 370,727 acres, representing three hundredths of 1% (0.03%) of all privately held agricultural land in the U.S. — roughly the size of an average county in Ohio. From 2022 to 2023, acreage linked to Russian investors declined by 52 acres (-83%), Iranian investors by 1,325 acres (-30%), and Chinese investors by 34,272 acres (-11%), while acreage linked to Venezuelan and Cuban investors remained unchanged.
There has been significant interest in U.S. agricultural land owned by Chinese investors. In 2023, 277,336 acres were linked to Chinese investors — 0.02% of all privately held U.S. agricultural land. This marks a 106,599-acre (27%) decline from the 2021 peak of 383,935 acres. Figure 6 illustrates trends in Chinese-investor-linked ownership since 2010.
The increase observed between 2012 and 2013 is primarily tied to the acquisition of a U.S.-based meat processing company, which now accounts for nearly half of all Chinese investor-held acreage. The subsequent decline between 2021 and 2023 stems from two key factors: a reduction in holdings by a Chinese billionaire who had invested in Southwest Texas for a renewable energy project, and the USDA’s reclassification of acreage originally attributed to Chinese investors but later confirmed to be owned by a U.S. land asset management company with operations in Chinese markets.
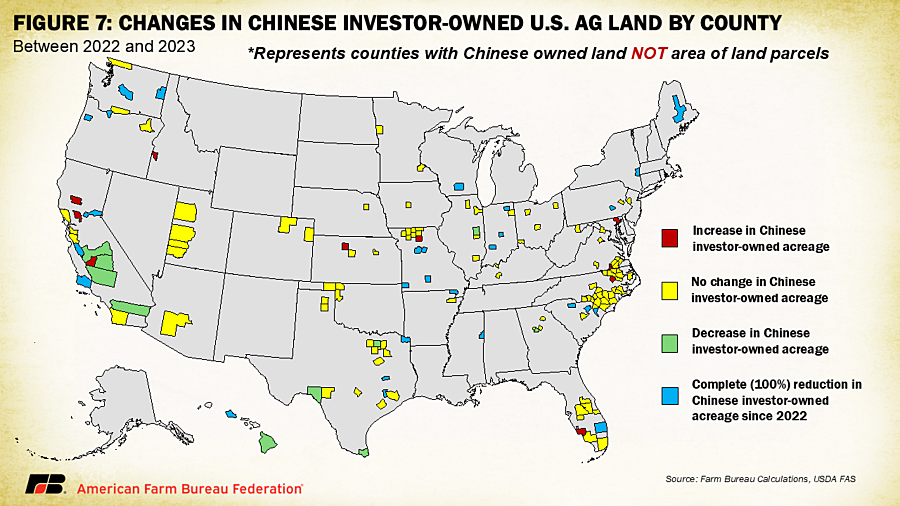
Between 2022 and 2023, Chinese investors held at least 1 acre of agricultural land in 147 counties across the U.S., out of 3,244 total counties and county equivalents. Of these, 38 counties experienced a decline in Chinese investor-owned acreage, with 29 counties seeing a 100% reduction in holdings. Conversely, 10 counties recorded an increase in Chinese investor-owned acreage, while the remaining 99 counties saw no change.
Figure 7 illustrates the county locations where Chinese investors owned at least 1 acre during this period, categorized by changes in ownership.
Conclusion
Foreign ownership of U.S. agricultural land continues to be a complex and closely watched issue. The latest AFIDA data highlights an increase in foreign-held acreage, driven largely by renewable energy investments from European entities, while also reflecting declines in ownership by investors from nations like China, Iran and Russia. The data reaffirms the majority of land is owned by investors from nations considered friendly to the U.S., though previously discussed data reporting limitations prevent us from accessing a precise breakdown.
These trends underscore the importance of robust oversight mechanisms, such as AFIDA and the Committee on Foreign Investment in the U.S., in maintaining transparency and safeguarding national interests. As foreign investment in U.S. agricultural land continues to grow and diversify, improving analysis and enforcement will remain critical to ensuring both economic and security considerations are effectively addressed.

