Hurricanes, Heat and Hardship: Counting 2024’s Crop Losses

Daniel Munch
Economist
AFBF has calculated crop and rangeland damage estimates since 2021 to provide a window into the impacts of natural disasters on domestic food production. This Market Intel updates total crop loss estimates across major weather events for 2024. AFBF’s methodologies changed between 2023 and 2024 to cover more causes-of-loss types. Therefore, totals between years are not directly comparable. The methodology for these calculations is described at the end of this article.
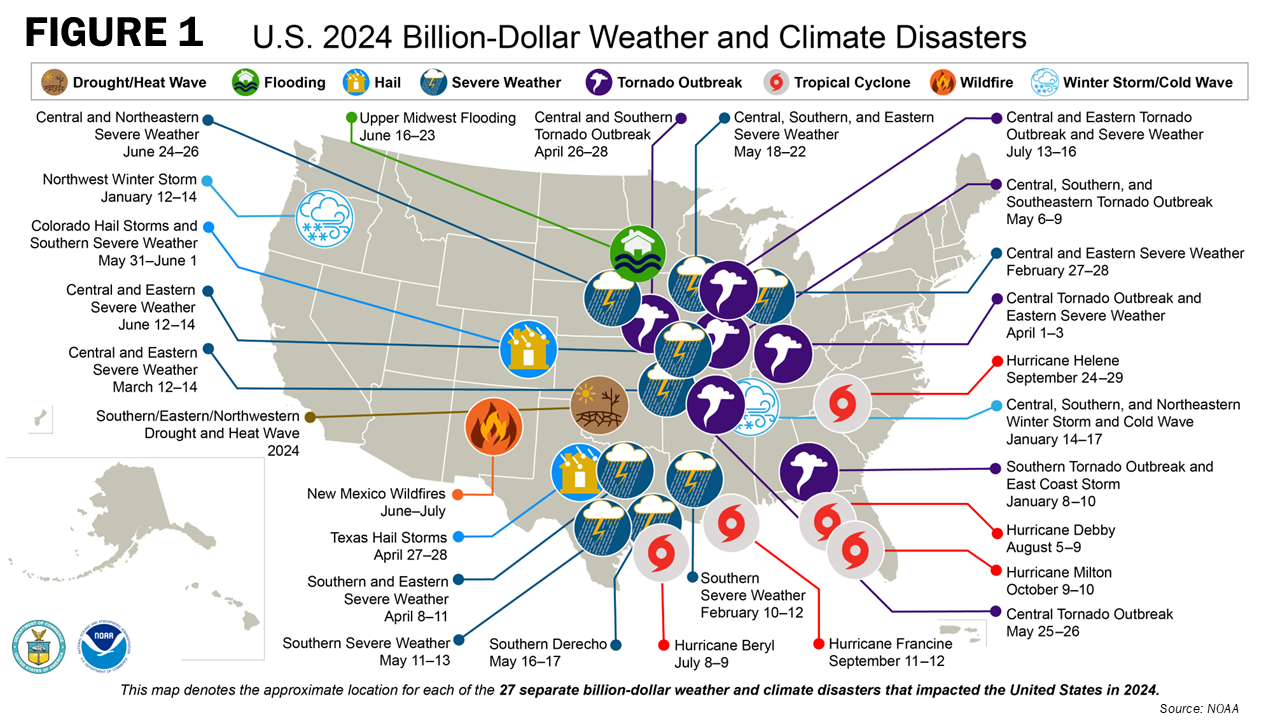
Weather-associated production risk is a part of life for farmers and ranchers. Through heavy rain, hail, snow, winds, fire and drought, farming families prepare land, plant and harvest knowing their livelihoods are reliant on local weather conditions. In 2024, 27 weather disasters, each with damages exceeding $1 billion, struck the U.S. coast-to-coast. The National Oceanic and Atmospheric Administration (NOAA) reported that 2024 ranked fourth in terms of the total inflation-adjusted economic impact of these events, with industries across the economy experiencing an estimated $182.7 billion hit (compared to $92.9 billion in 2023). With nearly 570 lives lost, these disasters will haunt impacted communities for years to come.
Overview of Estimated Crop Losses
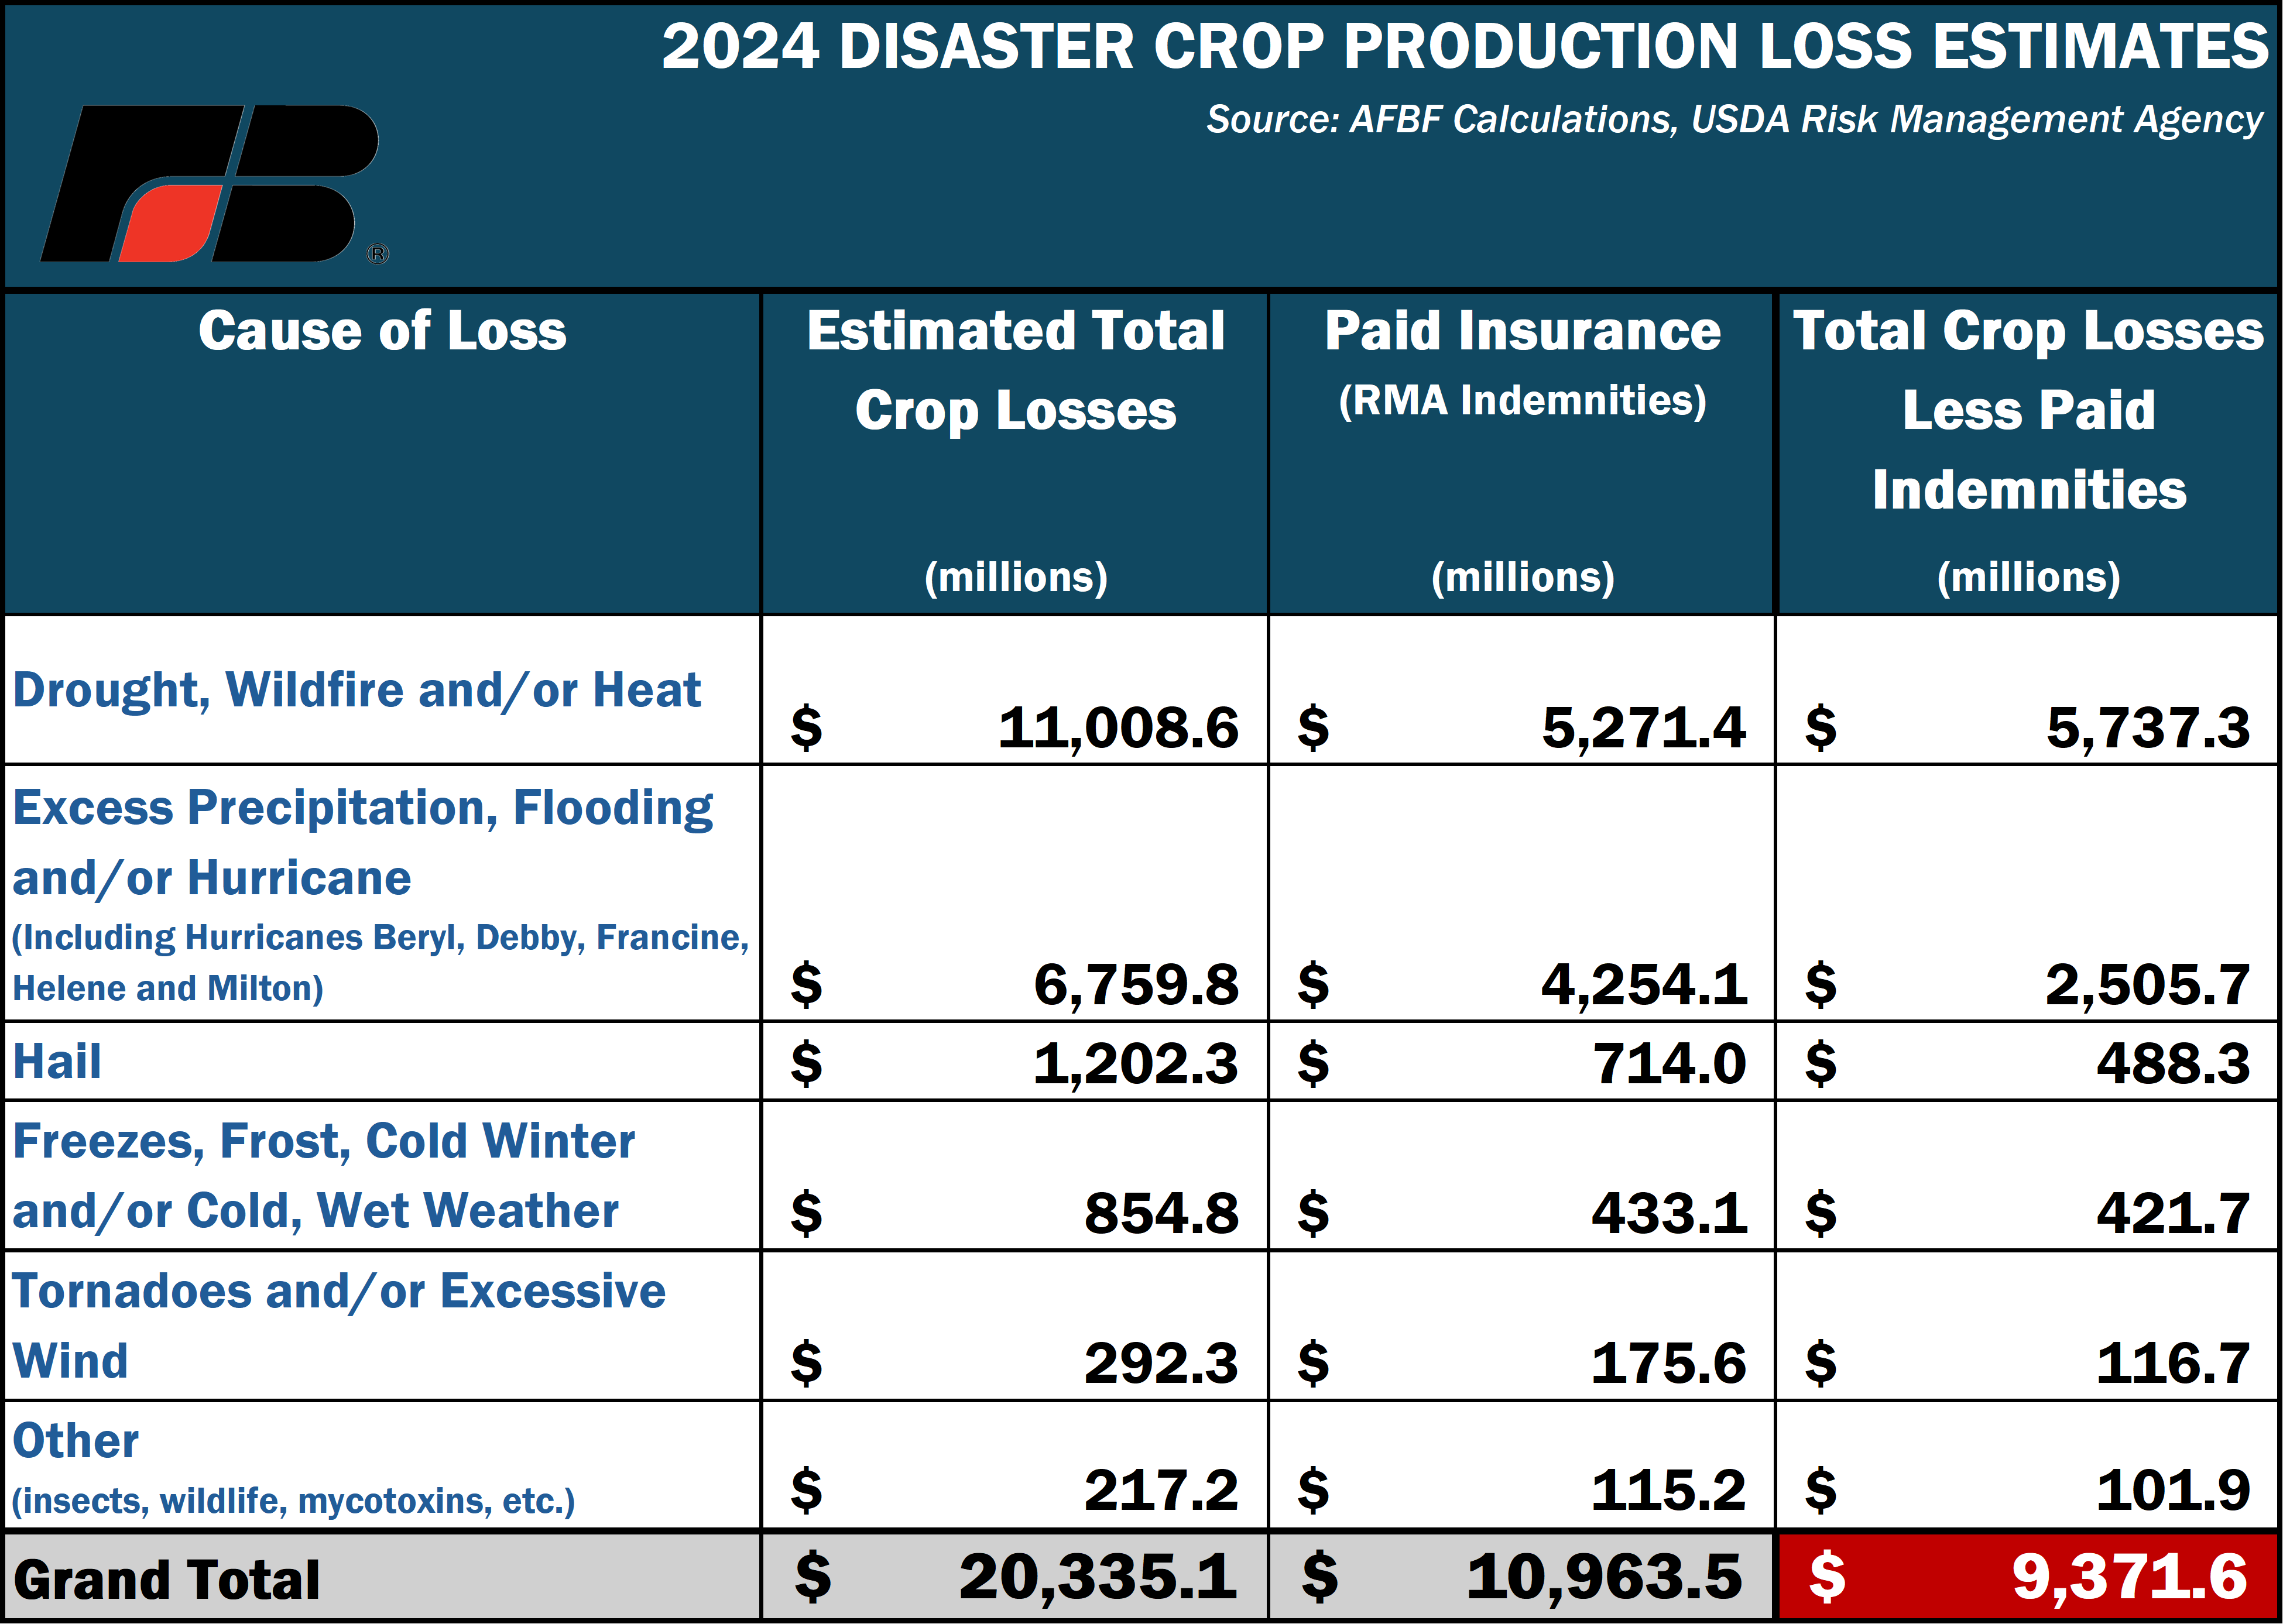
Updated 2024 crop and rangeland damage estimates highlight the devastating impact of natural disasters on U.S. farm production. Total losses to crops and rangeland (including apiculture) from major 2024 weather and fire events exceeded $20.3 billion, accounting for 11.1% of NOAA’s total economic impact from disasters. Of this total, $10.9 billion in losses were covered by Risk Management Agency (RMA) programs as of February 2025, while approximately $9.4 billion remained uninsured, fell outside policy coverage limits, or did not qualify under existing risk management programs.
Of the $158 billion in total RMA-insured crop value (liabilities), 7% resulted in indemnity payments in 2024. Notably, crop insurance played a critical role in mitigating these losses, covering over 53% of weather-related damages, providing essential financial relief to affected farmers. Drought, excessive heat and wildfires led to over $11 billion in crop losses, while excessive precipitation, flooding and hurricanes accounted for $6.7 billion. Hailstorms caused $1.2 billion in losses, while freezes, cold, wet weather and frost resulted in $854 million in damages and tornadoes and excessive wind led to $291 million in crop losses.
AFBF crop loss estimates do not include infrastructure damage, livestock losses (besides apiculture), complete horticulture crop losses or timber losses associated with the selected causes of loss. Estimates should be viewed as a minimum baseline since data to estimate these other categories are not readily available. More comprehensive analysis on individual storms may be available from local land-grant universities. For example the University of Georgia estimated a total ag economic impact of $5.58 billion from Hurricane Helene and the University of Florida estimated ag production losses up to $643 million from Hurricane Milton. In both cases, estimates include losses across additional categories (such as livestock and timber) that are not included in this AFBF analysis.
Additional factors also contributed to significant crop losses, many of which were exacerbated by challenging weather conditions and are only partially reflected in RMA data. At least $43 million was lost to insects, $34 million to plant diseases, $24 million to wildlife and $19 million — primarily in wheat — was lost due to mycotoxins, toxins produced by fungi and other molds. However, these figures vastly underestimate the true extent of losses due to insurance coverage limitations, exclusions and reporting challenges. Many federal crop insurance policies do not cover wildlife damage unless explicitly included, and even when coverage exists, indemnities may be capped or denied if the loss is deemed preventable. Similarly, insect damage, plant diseases and mold-related losses are often intertwined with other covered causes, such as drought or flooding. For example, if drought weakens a crop and makes it more susceptible to insect infestations or wildlife foraging, the primary reported cause of loss may be drought, leaving the actual damage from insects or wildlife unaccounted for in indemnity data. As a result, these figures are likely to represent only a fraction of the total economic impact of these additional loss factors.
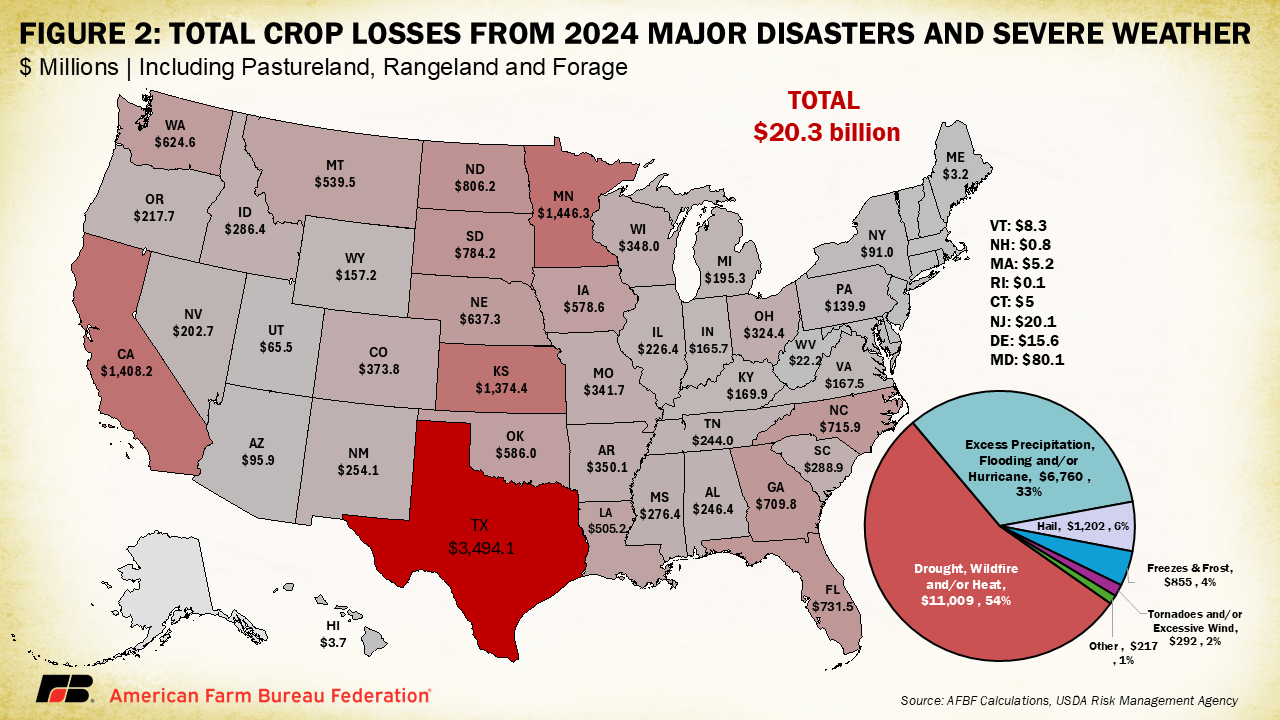
In 2024, Texas suffered the most significant agricultural losses for the third consecutive year, with total incurred damages exceeding $3.4 billion. Cotton was the hardest-hit crop, sustaining $1.8 billion in losses, followed by $768 million in forage and rangeland damage and $257 million in wheat losses. More than 66% of Texas' total losses were attributed to widespread drought, excessive heat and hot wind, with the most severe impacts occurring between June and September.
Minnesota ranked second, with $1.45 billion in weather-related crop losses, including $678 million in corn, $528 million in soybeans, and $113 million in forage. Intense flooding in June drove more than 80% of the state's total losses, severely impacting agricultural production across the Upper Midwest.
California followed closely behind, with $1.4 billion in crop losses. Over $660 million was attributed to drought and heat-related damage, while $500 million resulted from flooding and excessive precipitation. The state's fruit and nut industry suffered over $860 million in losses, including $272 million in grapes, $204 million in pistachios, $94 million in almonds, and $66 million in mandarins and tangerines. Additionally, California rice losses totaled $176 million in 2024.
Losses by Crop Type
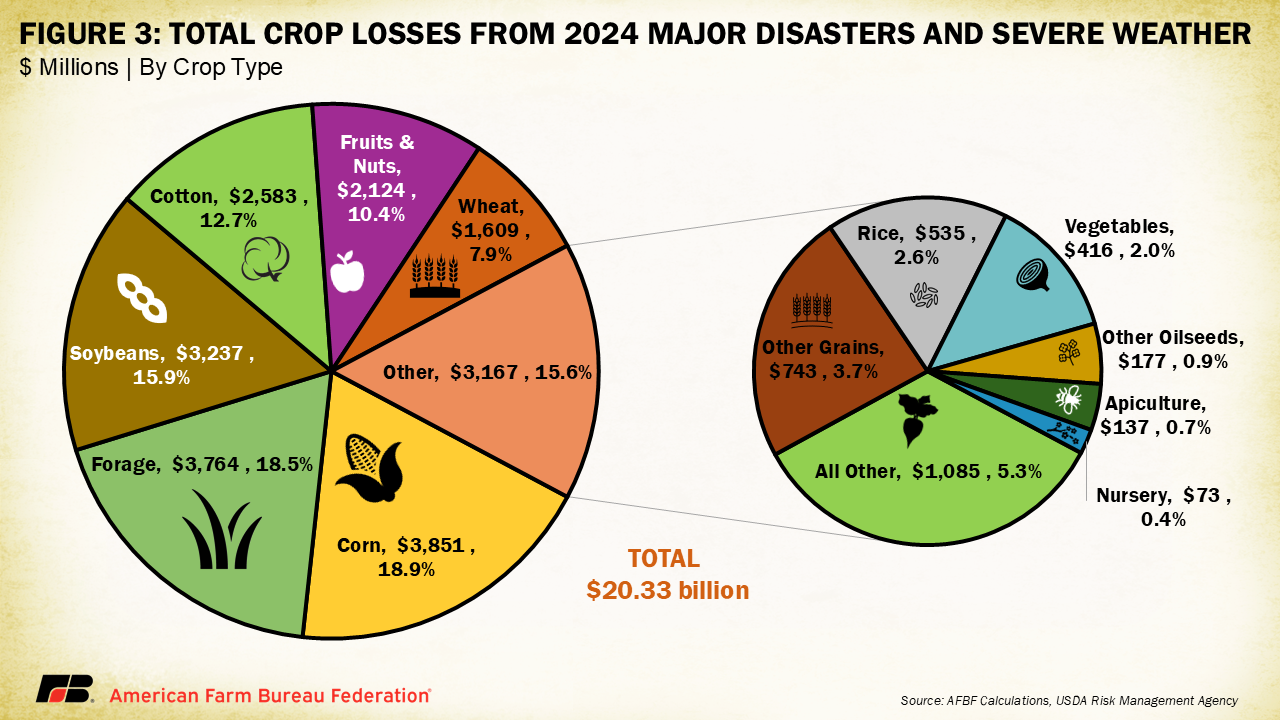
Figure 3 displays overall crop losses by type across all major weather events in 2023. The other grains category includes crops like oats and sorghum, the other oilseeds category includes canola, mustard, flaxseed, etc. and the all other category includes miscellaneous crops like tobacco, sugarcane, sugar beets and mint. Flooding and excessive precipitation across the Upper Midwest, combined with corn’s dominant role in U.S. agriculture, kept corn losses at the top, totaling $3.85 billion in 2024. Forage losses ranked second, reaching $3.8 billion, driven primarily by widespread drought conditions in states such as Texas, South Dakota, Kansas and Oklahoma. Soybeans followed in third, with $3.2 billion in losses, largely due to the same flood-induced conditions that impacted corn. Cotton ranked fourth, with $2.5 billion in losses, primarily attributed to drought in Texas and Oklahoma and hurricane-related damage across the Southeast.
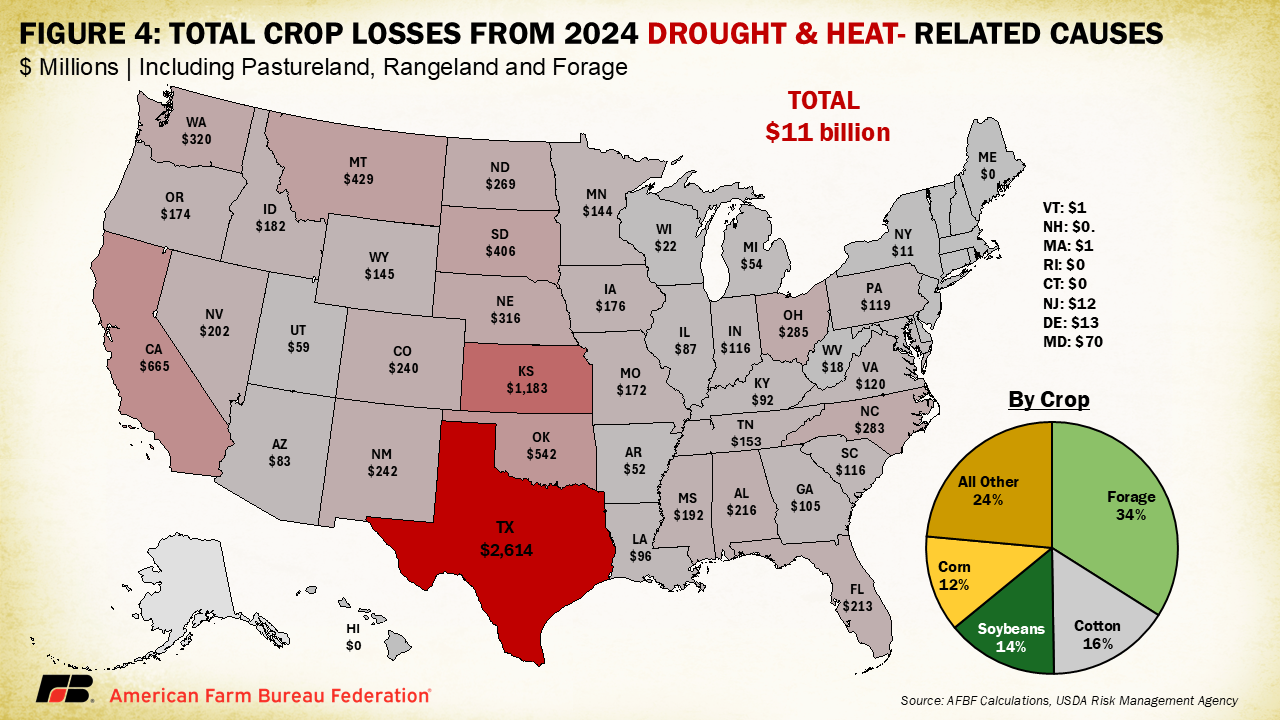
Losses Due to Drought, Wildfire and Other Heat-Related Causes
Despite the widespread impact of flooding and hurricanes throughout 2024, drought and heat-related conditions — including excessive heat, prolonged sun exposure, hot wind and wildfires — accounted for the largest share of total crop losses, reaching over $11 billion. Of this amount, $5.3 billion (47%) was covered by RMA insurance policies, while $5.7 billion (53%) fell outside of coverage.
While drought wasn’t as dominant a concern as in previous years, it remained a significant challenge, particularly in late September and October, when more than 27% of the country was classified under severe (D2) drought or worse. The hardest hit crops in this category were forage and rangeland, which suffered $3.7 billion in losses, cotton at $1.7 billion and soybeans at $1.5 billion.
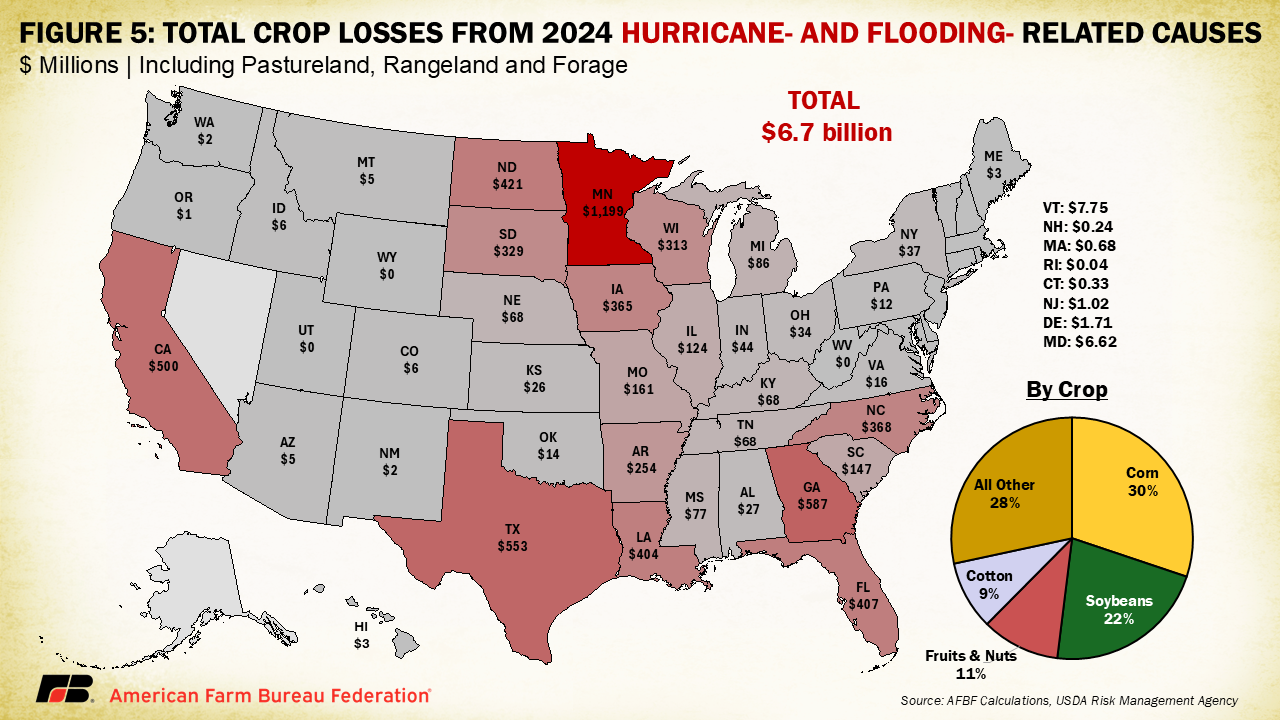
Losses Due to Hurricanes, Tropical Storms, Flooding and Excessive Precipitation
Record flooding across the Upper Midwest and horrific hurricanes across the Southeast drove much of the year’s agricultural natural disaster-related news cycle. When combined with the numerous other torrential rain and severe storms across the country these causes resulted in $6.7 billion in crop losses. Of this, $4.3 billion (63%) was covered by RMA insurance policies while $2.5 (38%) billion fell outside of coverage. Corn faced the biggest hit under this category at over $2 billion, followed by soybeans at $1.5 billion, fruits and nuts at $707 million and cotton at $621 million, with the former two linked to Midwest flooding and latter two linked to Southeast hurricanes.
Hurricanes
Hurricanes Helene and Milton devastated the Southeast in September and October, respectively, claiming at least 251 lives and destroying hundreds of homes and vital infrastructure. NOAA estimated total economic damages of Hurricane Helene at $78.7 billion and Hurricane Helene at $34.3 billion. When combined with the economic toll of hurricanes Francine, Debby and Beryl, the 2024 hurricane season inflicted over $124 billion in total losses — accounting for 68% of NOAA’s total 2024-billion-dollar weather disaster damages estimate.
Isolating individual hurricane-related losses is challenging, as many claims were reported within the same months and under broader cause-of-loss categories. However, across the Southeast, at least $3 billion in crop production was lost. An important reminder, this figure excludes damages to infrastructure, equipment, timber and livestock, meaning total agricultural impacts are far greater.
In Georgia, Hurricane Helene alone caused over $195 million in peanut losses, $164 million in cotton, $51 million in pecans and $49 million in blueberries. In Florida, hurricanes destroyed $155 million in peppers, $50 million in nursery crops, $48 million in peanuts, $42 million in sugarcane, $40 million in fresh market tomatoes and over $7 million in strawberries.
Louisiana bore the brunt of Hurricane Francine, leading to $141 million in sugarcane losses, $78 million in rice and $70 million in soybeans. In North Carolina, Hurricane Helene wiped out $151 million in flue-cured tobacco, $13 million in blueberries and $10 million in apples. In South Carolina and Tennessee, corn, cotton and soybeans suffered the most damage, while Virginia saw $9.6 million in tobacco losses.
Texas also faced extensive agricultural losses, with these causes contributing to $227 million in cotton losses, $108 million in corn and $91 million in rice losses. The 2024 hurricane season was one of the most destructive in U.S. history, with severe consequences for farmers, rural communities and agricultural supply chains.
Disaster Assistance in the Pipeline
For the past three years, farmers have faced billions in uncovered losses due to natural disasters, highlighting critical gaps in federal disaster relief. In 2022, producers suffered over $10.4 billion in uncovered losses, representing damages that either fell outside crop insurance coverage levels or did not qualify under existing risk management programs. To address these challenges, President Biden signed the Disaster Relief Supplemental Appropriations Act on Dec. 29, 2022, allocating $3.74 billion in aid for producers who lost crops, trees, bushes and vines due to qualifying disasters that year. However, this assistance covered only 36% of the total uncovered losses, leaving a $6.74 billion shortfall that has yet to be fully addressed.
In 2023, farmers faced $9.9 billion in uncovered losses, followed by the estimated $9.4 billion in 2024, bringing the three-year uncovered total to over $26 billion in losses left outside insurance and past disaster aid programs.
A major step forward came with the passage of the American Relief Act of 2025, signed into law in the early hours of Dec. 21, 2024, which provides $21 billion in natural disaster aid. This funding is intended to cover losses of revenue, quality and production for crops — including milk, on-farm stored commodities, prevented planting acres and harvested but adulterated wine grapes — as well as losses to trees, bushes and vines caused by disasters in 2023 and 2024.
While this funding is a much-needed lifeline for struggling farmers, it still leaves a gap of at least $4 billion to make crop producers whole, dating back to 2022. Additionally, as of Feb. 12, 2025, USDA has not yet released details on how or when the $21 billion in disaster aid will be distributed, prolonging the financial uncertainty for farmers who continue to grapple with unpaid bills from previous years. With 2025 shaping up to be another unpredictable year, timely implementation of these funds will be critical to stabilizing farm operations and supporting rural economies.
Market Intel Methodology
This analysis leverages RMA crop insurance data to estimate total crop losses as if all acreage was fully insured at 100% coverage. The methodology closely follows the approach used by NOAA’s National Climatic Data Center in its annual “Billion Dollar Climate and Weather Disasters” reports, originally outlined by Smith and Katz (2011).
For 2024, though, AFBF analysis was expanded to incorporate indemnities from all weather-related causes of loss, rather than limiting the assessment to states experiencing NOAA-designated billion-dollar disasters or those included in the Federal Emergency Management Agency’s presidential disaster list. This broader approach captures weather-related crop losses across all states, providing a more comprehensive picture of the economic impact on U.S. agriculture.
RMA reports on total indemnities (total insurance compensation) paid for each cause of loss (drought, hurricane, flooding, fire, excess moisture, frost, etc.) in a given month for each crop type by state. Different cause of loss categories were combined to reflect different categories of weather events. For example, drought, heat, hot wind, fire and excessive sun were selected for the drought, wildfire and heat category. Once indemnity payments for crops were totaled, adjustments were made for losses outside insured acreage and coverage levels.
This is achieved by first calculating the percent of insured acres in each state (using 2022 data from USDA’s National Agricultural Statistics Service and 2023 RMA summary of business data). We assume all acreage of a given crop within a state has been equally impacted by a particular disaster. Then RMA coverage level data is used to find the average coverage rate for each crop in each state. Based on these stats, a factor approach defined as 1/ [(% acres insured) (average coverage level %)] is used to come up with a multiplier to estimate 100% of losses. This was repeated for crops in each affected state and totaled.
Using a real-life example: In Florida, 56% of pepper acreage was insured in 2022. Of the covered pepper acreage in Florida, insurance covered an average of 62% of losses. Following the formula described above, Florida pepper indemnities were multiplied by 1/(0.56*0.62), or 2.88, to estimate 100% of losses.
One particularly complex cause of loss category, “ARPI/SCO/STAX/MP/HIP WI Crops Only,” reflects indemnities paid under specialized crop insurance programs that extend beyond traditional individual farm policies. Of the indemnities recorded under this category, 91% are tied to pasture, rangeland, forage (PRF) and annual forage, which rely on area-based, rather than farm-specific, assessments. While it is difficult to assign a specific weather-related cause of loss to these indemnities, in this analysis it is assumed that the majority stem from drought conditions. This assumption is based on the fact that PRF and annual forage policies under this category are structured around Rainfall Index insurance, which compensates producers when precipitation falls below historical averages. Given the extensive use of these policies in drought-prone regions, indemnities in this category likely reflect widespread precipitation deficits rather than localized disaster events.
Top Issues
VIEW ALL