Livestock Market Update for The Second Half of 2024

Bernt Nelson
Economist
Introduction
July 2024 marks the first time since 2016 that USDA’s National Agricultural Statistics Service has not published its July Cattle Inventory report, which would typically come out this week and contain data about the size of the calf crop, which producers and analysts would use to gauge if the cattle inventory is expanding, contracting or holding steady. In an announcement in April, NASS cited budget constraints as the reason for cancelling this report along with county level production and yield data and the objective cotton yields survey.
The 2024 cattle inventory is the lowest it has been since 1951, which has sent beef prices soaring. The hog industry is looking profitable, too, but has a lot of ground to make up for with last year’s losses as well as supply chain complications caused by California’s Proposition 12. Poultry including eggs, broilers and turkeys are continuing to contend with Highly Pathogenic Avian Influenza (HPAI). This Market Intel will use data from several USDA reports to assemble the market outlook for animal proteins for the second half of 2024.
Cattle
Supply
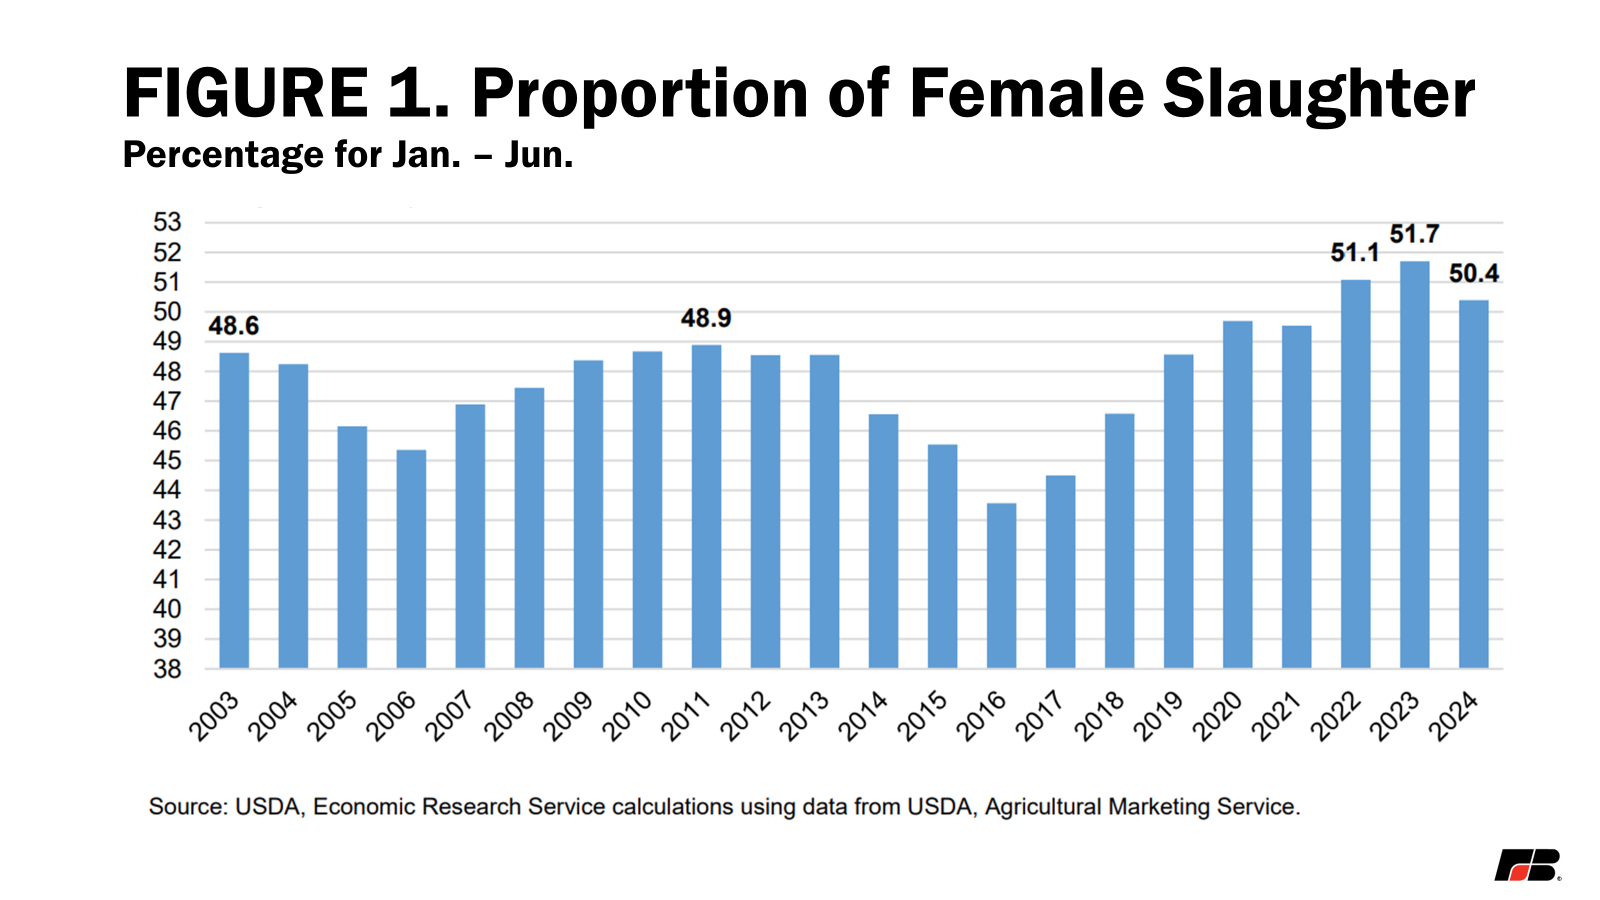
USDA estimated in its January Cattle Inventory report that all cattle and calves in the United States were 87.2 million, the lowest since 1951. The country’s cattle producers, facing stress from multiple years of drought and high supply costs, have been marketing a lot of cows and heifers since 2020 (Figure 1), so fewer of these female cattle are available to produce calves. USDA’s July Cattle Inventory previously provided a breakdown of the U.S. cattle inventory including the calf crop for the first half of the year. Without this report in 2024, it is much more difficult to estimate what cattle supplies look like for the remainder of the year. Farmers and stakeholders will have to wait until January to receive this data. In the meantime, analysts will be using what they do have available to piece together the overall market outlook.
Feedlot inventories are slowly reflecting the lower cattle inventory. In its July Cattle on Feed report, USDA estimated all cattle and calves on feed in the United States was 11.3 million on July 1, up 1% from a year ago. Heifers and heifer calves accounted for 4.48 million head. While this is up only slightly, this is near the record-high number of heifers and heifer calves for the July 1 report and makes up about 40% of the overall cattle on feed. Historically, heifers make up around 32% of the overall cattle on feed. This is a strong indicator that farmers are still not withholding heifers to rebuild the U.S. cattle herd.
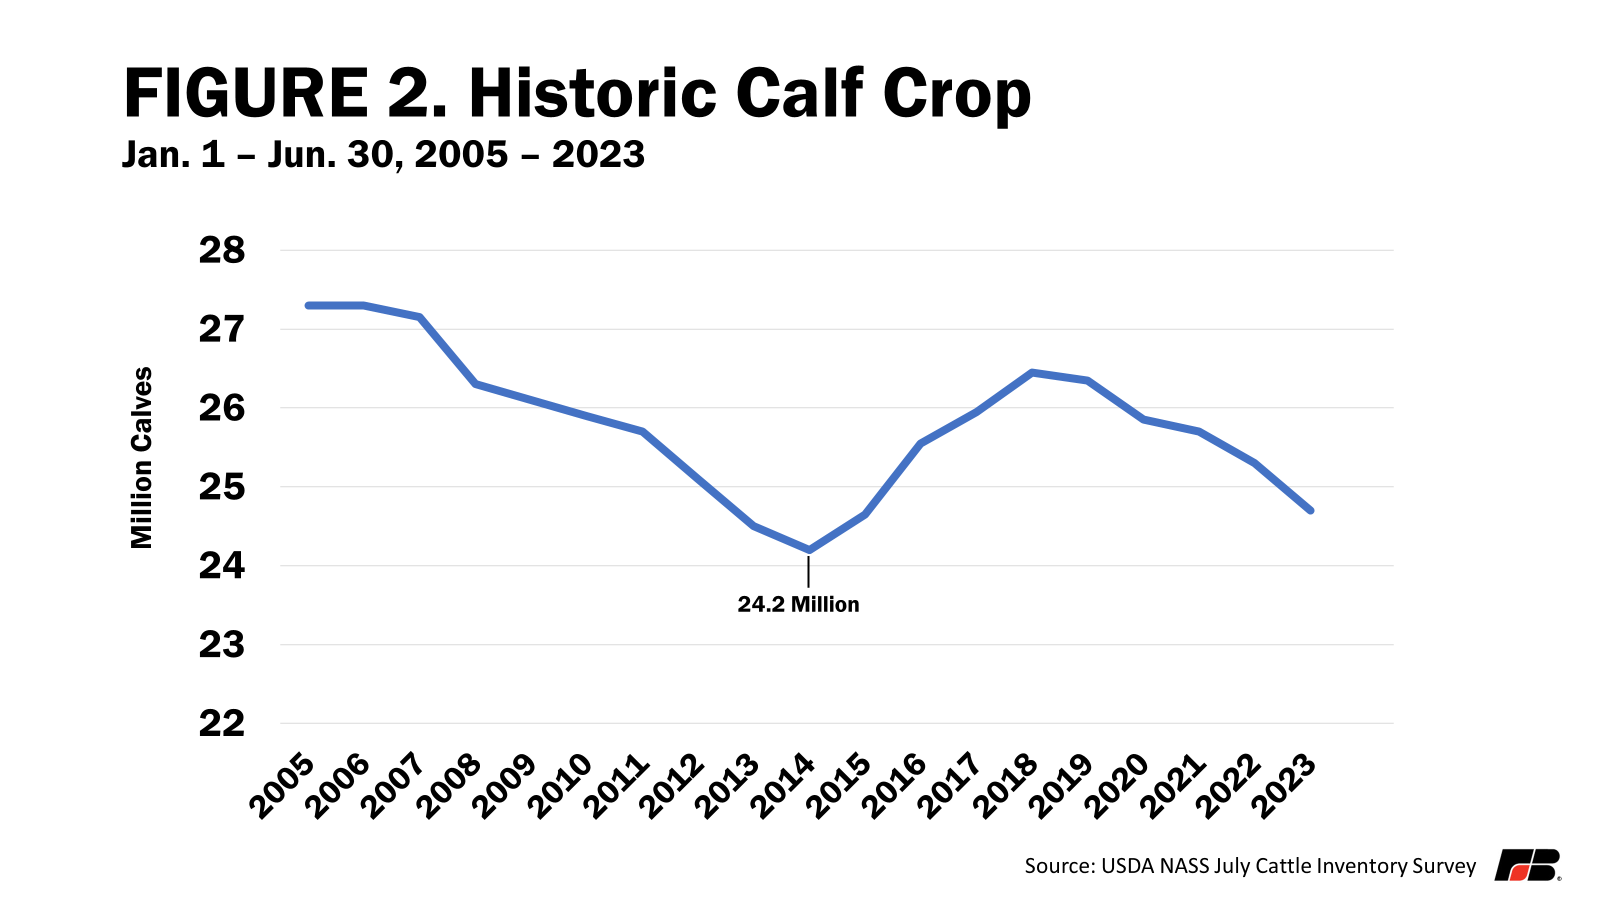
One particularly important metric the July Cattle Inventory would have provided is the size of the calf crop for the first half of the year. This is the time when most of the U.S. calf crop is born. It takes about a year for a heifer calf to reach maturity for breeding. These calves that could be replacements will not reach breeding age until 2025. The first opportunity for herd expansion will be possible if farmers begin to withhold heifers from this year’s calves for breeding in 2025. This means the arrival of the 2026 calf crop will be the first opportunity on the horizon to increase the cattle inventory. The 2023 July Cattle Inventory report estimated a Jan. 1 – June 30 calf crop of 24.7 million head (after later adjustments, see Figure 2). The record-low calf crop since the July Cattle Inventory survey began is 24.2 million in 2014. A drop of just 2% from last year’s calf crop would tie the record low. Addressed earlier, it is apparent that a high number of female cattle are still being placed on feed for slaughter rather than being withheld for breeding purposes. This means that a record-low calf crop for the first half of the year is possible.
Demand/Prices
Summer demand has helped push prices up. Choice grade beef has worked its way above $300/cwt and was up $1.04 on July 29 at $314.81. On the same day select grade was up $4.06 at $301.52/cwt. Something that can be helpful in gauging the demand for beef is the difference between choice and select grade beef. A wider difference between choice and select beef often indicates a consumer is willing to pay more for premium cuts of beef where a narrowing difference may show that consumers are more willing to settle for a lower quality cut. The current spread sits at $13.11, which is just below the year-over-year average of $16.08. This spread has been widening since late March, which is typical when the grills come out for warmer spring and summer months. July average cash fed steer prices have ranged from $188/cwt to $192/cwt. As we approach fall, cattle available for placements on feed should slow down. This should bring higher cash prices at the sale barn, which will drive beef prices higher as well.
Hogs
Supply
USDA’s Quarterly Hogs and Pigs report, released on June 27, contained some important data relating to the U.S. hog inventory. According to this report, the inventory of all hogs and pigs was 74.5 million head, up 1% from June 2023. The breeding inventory was 6.01 million head, down 3% from last year. Market hogs were 68.5 million head, up 2% from last year.
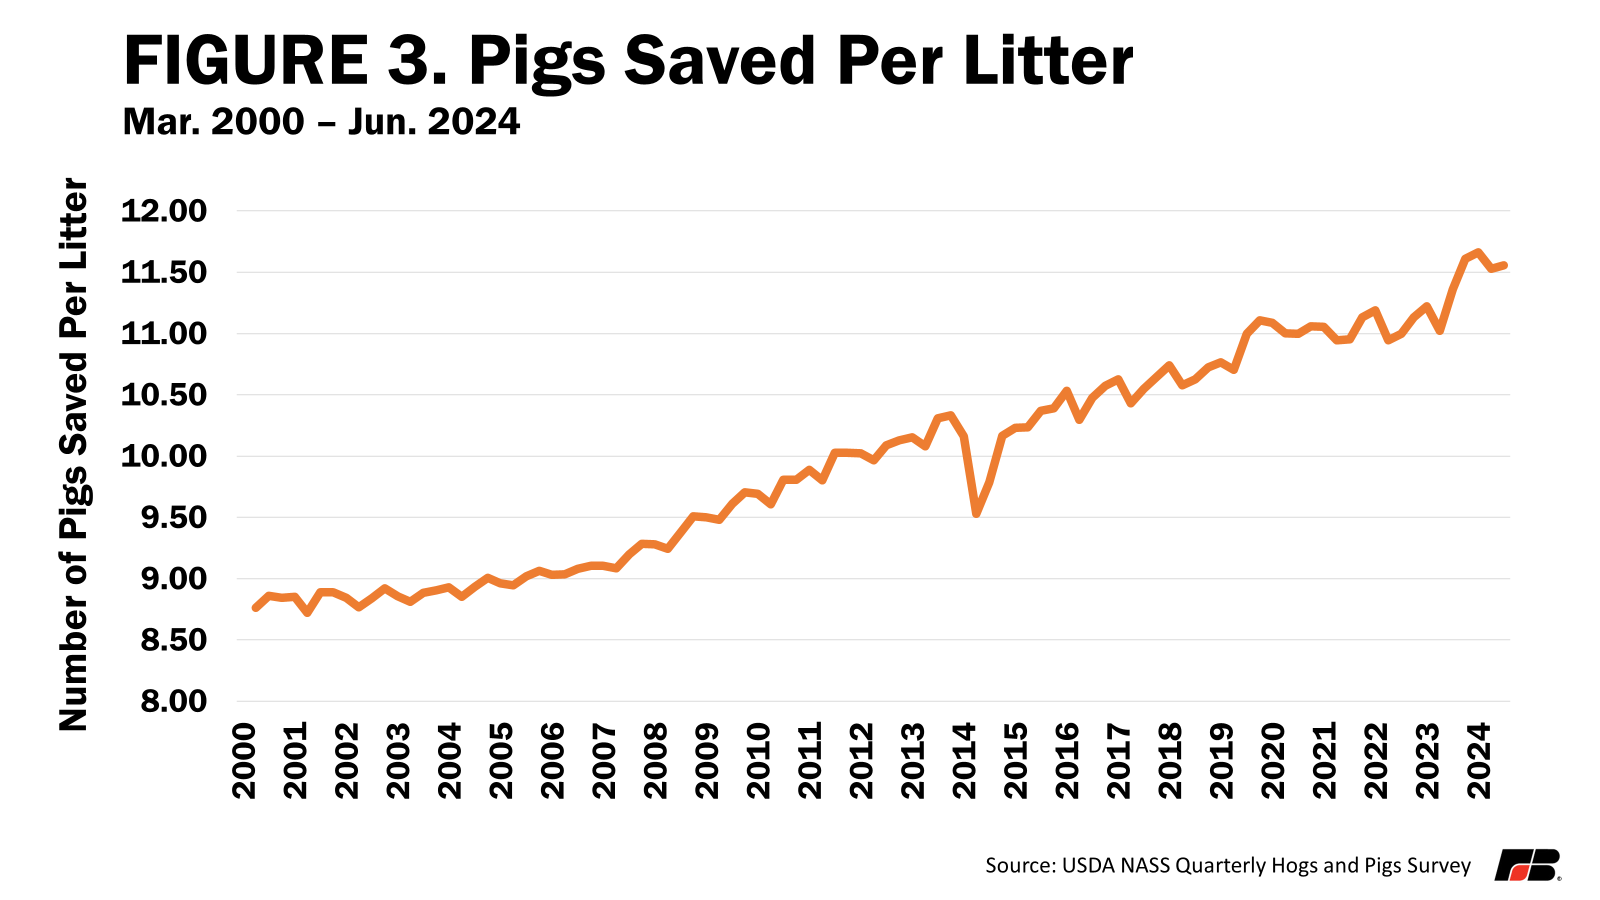
Much like the calf crop supplies cattle for the next year, the pig crop in the first half of the year supplies hogs for the second half. The March through May pig crop was 34 million, up 2% from last year, bringing the average pigs saved per litter to 11.56, which is the third-highest average in survey history (Figure 3). When combined with the December through February pig crop and the slightly higher-than-expected weights from lower feed costs, USDA estimates 2024 pork production at 28 billion pounds, about 3% more than 2023. Increased production is bearish news, especially for the cutout, and could bring lower hog prices for farmers in the second half of 2024.
Demand/Prices
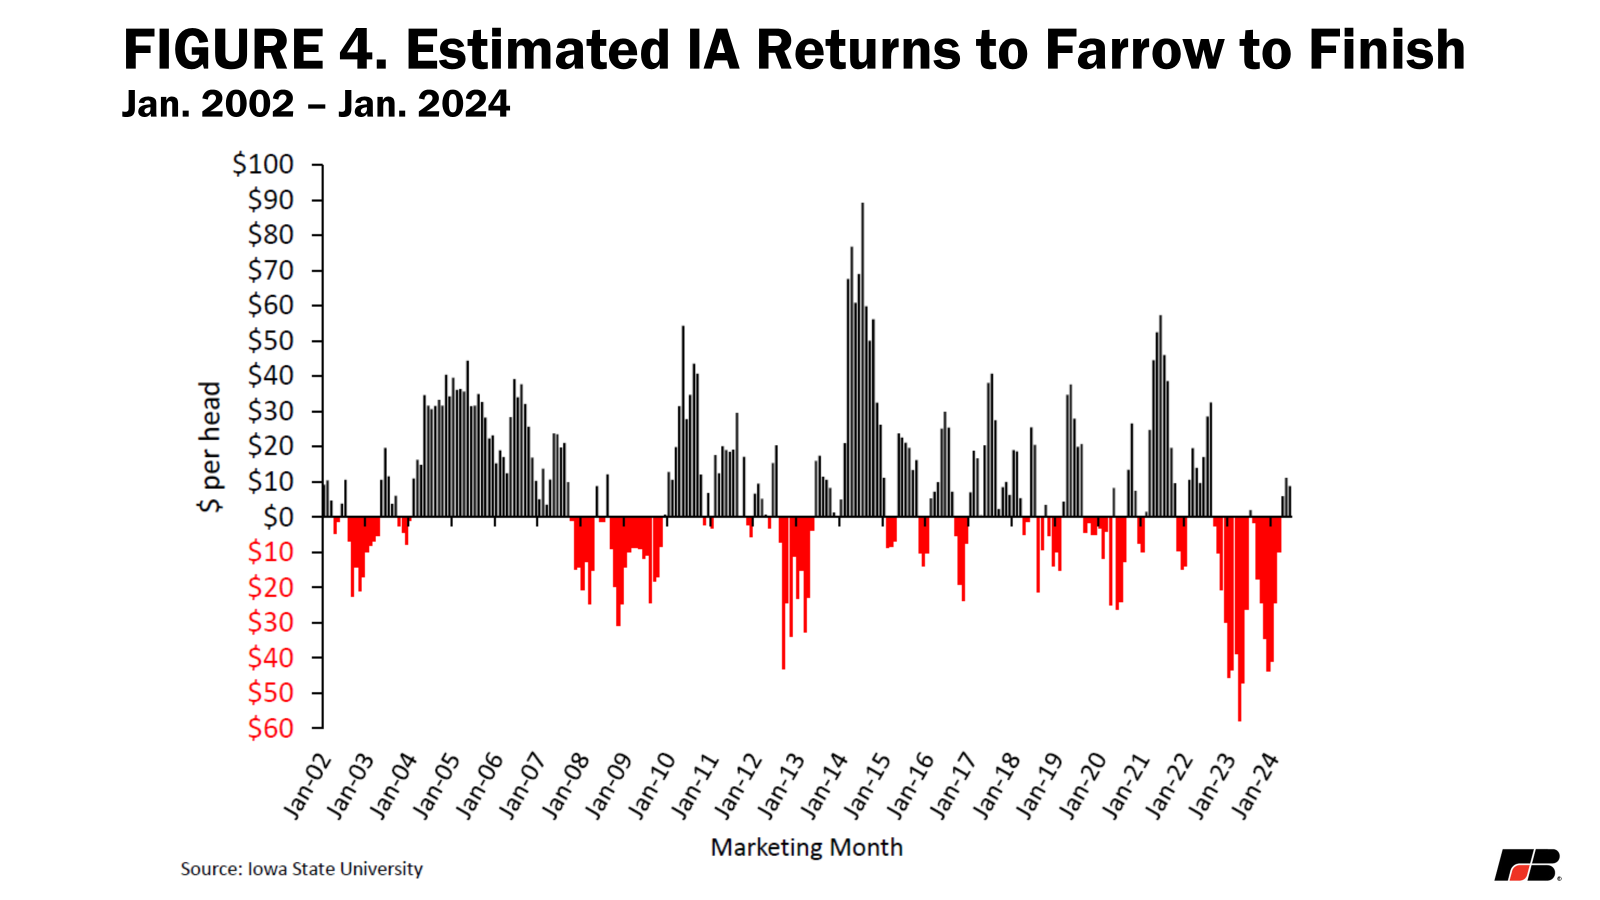
Hog farmers faced devastating average losses of about $31 per head in 2023. Elevated input costs, particularly from feeds and inflated fixed costs, were responsible for losses. Iowa State University’s June 2024 estimate for returns to farrow to finish operations shows a profit of $8.82 per hog, up 133% from -$26.18 in the same time period in 2023 (Figure 4). The majority of this difference comes from the 25%, or $31 per head, drop in the cost of feed from June 2023. Despite the much-needed boost from lower feed costs, the cost of fixed inputs such as fuel and utilities remain elevated from inflation. This will continue to be an obstacle to profitability while pork struggles to find demand.
In its July World Agricultural Supply and Demand Estimates report, USDA estimates the annual U.S. per capita demand for pork is 51 pounds per person. This is up 0.4 pounds per person from June projections and up 0.8 pounds from last year’s per capita demand.
While current domestic demand is just not enough to bump prices up, export demand has been extremely supportive for hogs. As of July 18, total pork export sales were 967.2 thousand metric tons, up 6.7% from 2023. Mexico has been an essential trade partner, purchasing 369.1 thousand metric tons year to date, up just slightly from last year but 278% higher than the second-largest importer of U.S. pork, Japan. Hog slaughter for the week ending July 26 was 2.44 million head, the highest weekly slaughter since April. This means there is more product available in the short run as products like hams hit their highest prices of the year. Since Mexico has been such a big player in the U.S. ham market, these higher prices may slow export demand from Mexico, ultimately putting downward pressure on prices, especially in the short run.
The latest CME lean hog index has been in an upward trend since early July. The index was $91.85/cwt on July 29, while the national average cash price picked up $1.94, bringing the price to $84.07/cwt. Currently daily slaughter numbers are elevated. Slaughter hog supplies are expected to grow as we move closer to fall and winter months, which may lead to falling cash prices.
Poultry/Eggs/HPAI
Broilers
USDA adjusted 2024 broiler production and prices down in its July Livestock, Dairy, and Poultry Outlook. May 2024 broiler production is estimated to be 3.99 billion pounds, down a little over 1% from last year. Average weights are also down. USDA adjusted second quarter production to bring the total forecast for 2024 broiler production to 46.78 billion pounds, up about 0.8% from 2023.
Chicken has the highest consumer demand of any meat in the United States. According to USDA’s June WASDE report, per capita demand for broiler meat is 101.6 pounds per person, up 2.1 pounds per person, or 2.1%, from 2023. This increase may be due to higher prices for substitutes such as beef. Interestingly, per capita demand for broiler meat is just 9 pounds, or 8%, less than per capita demand for all red meat combined.
Eggs
In its June Chickens and Eggs report, USDA estimates June egg production at 8.81 billion eggs, down 2% from last year. The breakdown includes 7.56 billion table eggs and 1.25 billion hatching eggs. Of these hatching eggs, 1.15 billion were broiler-type while 96.7 million were egg-type. The number of layers in June 2024 was 371 million, down 3%, while egg production per 100 layers was up 1%.
Egg sets (eggs placed in incubators) are important for ensuring a healthy supply of hatching eggs. When farmers are faced with a decrease in egg hatchability or an expected reduction in production, they begin setting more eggs to achieve the desired number of chicks for placement, which happens about three weeks after hatching. Egg sets peaked in April at 5.4% above the five-year average. Three weeks later in May, chicks placed were 4% above the five-year average. Egg sets in July were also 4% above the year-over-year average while chick placements were up only .7%.
Table egg layers have suffered from HPAI outbreaks, with the most recent detections occurring on July 24 in Colorado and affecting about 3.4 million birds. There were zero HPAI detections in table egg flocks in June. However, 5.6 million birds were lost in May. The egg laying flock inventory in June consisted of 305.9 million birds, a loss of less than half a million from May. This shows some resilience considering how many birds were lost in May from HPAI but is still only slightly above the 2022 inventory. Based on this data, second quarter USDA forecasts for production were adjusted up 10 million dozen to 1.9 billion dozen eggs. While this is down 2.6% from last year, when combined with third and fourth quarter adjustments, 2024 table egg production is adjusted up 10 million dozen, bringing the total just shy of 7.8 billion dozen eggs, about 0.9% below 2023.
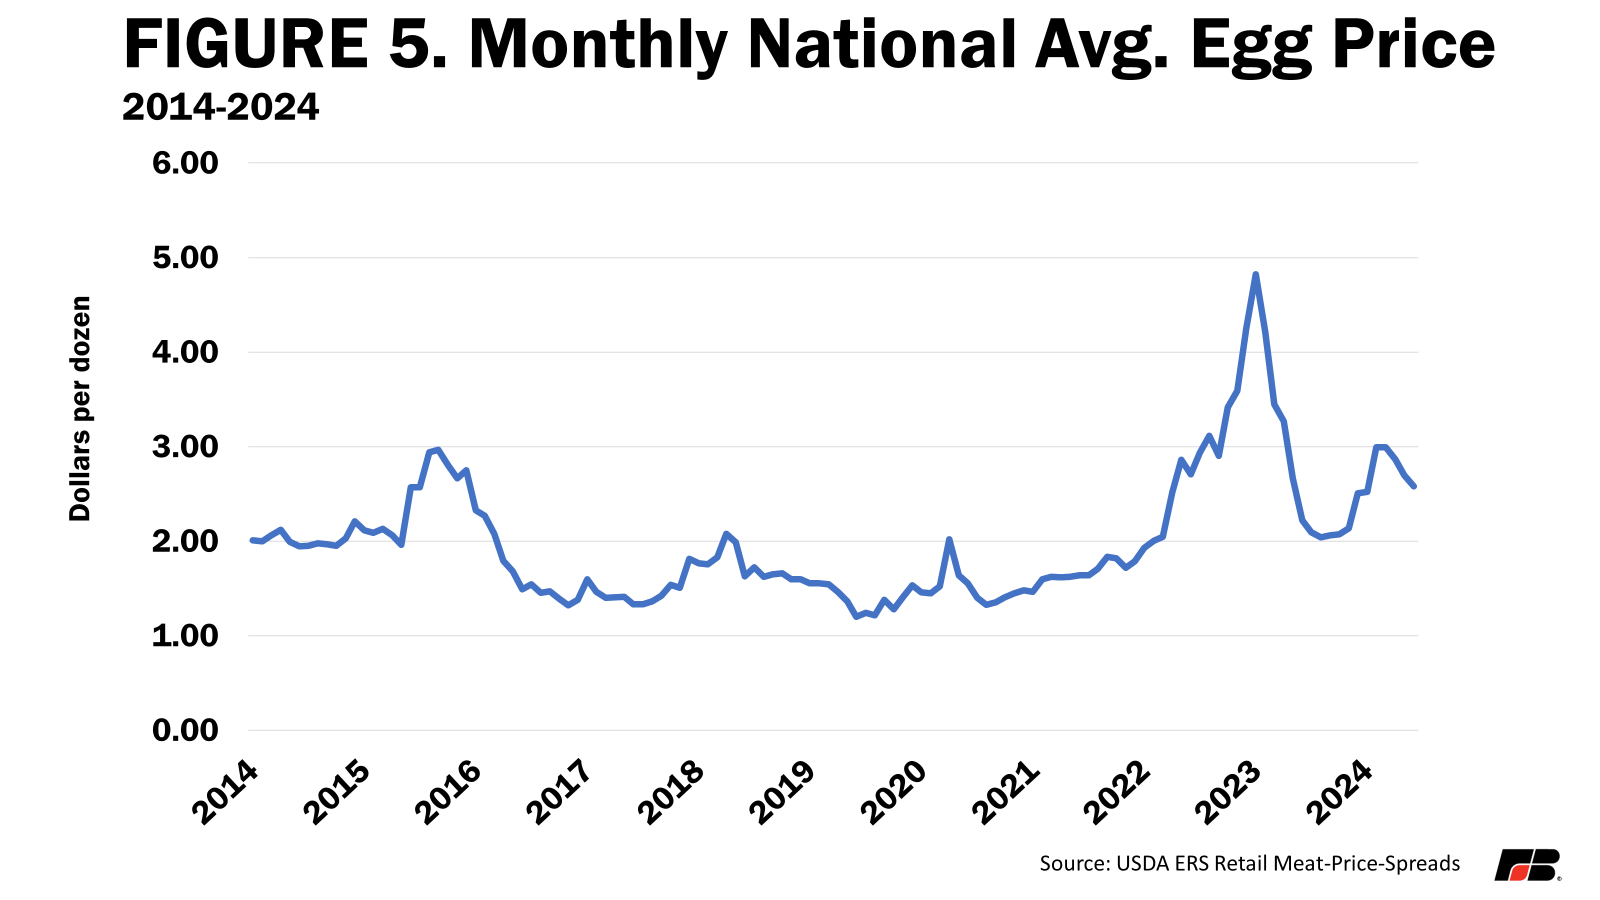
The average New York June wholesale price for large eggs was $2.58 per dozen (Figure 5). This brings the average second quarter price to $2.27 per dozen, about 7 cents, or 3%, above last month’s estimate and about 91 cents, or 70%, above the average second quarter price for 2023. Egg prices are relatively stable for now. However, with the table egg layer inventory as low as it is, any fall outbreaks of HPAI have the potential to drive up prices.
Turkey
USDA releases its annual Turkeys Raised report near the end of September, just ahead of Thanksgiving festivities when the majority of turkey is consumed in the United States. This report contains production data relating to turkey supplies for the current year. USDA published data on turkey production in two other monthly reports, The Livestock, Dairy, and Poultry Outlook and Poultry Slaughter.
According to USDA’s July Livestock, Dairy, and Poultry Outlook, May 2024 turkey production was 441.1 million pounds, down about 9.6% from May 2023, while slaughter was down 11.8% from last year. Average turkey weights were 2.7% higher year over year, leading USDA to increase production estimates by 15 million pounds, to 1.34 billion pounds for the first half of the year. This is 5.3% lower than last year. The turkey industry has proven susceptible to HPAI mostly due to farms’ geographic location along the central flyway, a migratory path for wild birds. In 2024, 1.2 million turkeys have been lost nationally to HPAI, including June outbreaks in Iowa and Minnesota affecting a combined total of 549,500 turkeys.
June is an important month for turkey production. Eggs in incubators during June typically hatch in July. These chicks are then placed on feed to grow in time for Thanksgiving in November. Just under 23 million eggs were in incubators on June 1, a record low. Due to low egg numbers and reduced production, the turkey sector is looking at greater risks from HPAI than in 2023. USDA estimates projected production for 2024 will be 4.215 billion pounds, down 4.5% from 2023. The 2024 average wholesale price estimate for turkey is 95.7 cents per pound, down 44 cents from 2023.
Summary and Conclusions
Livestock markets for the second half of 2024 are a mixed bag. Shrinking cattle supplies along with strong beef demand will keep cattle and beef prices strong through 2024 and likely through 2025. Hog producers have had some relief from last year’s losses but still face considerable obstacles to maintaining profitability as production is forecast to increase through the remainder of the year. The poultry industry is facing risks associated with HPAI, adding uncertainty as we soon transition to fall when migratory birds begin their annual trip south.
While profitability in livestock is holding for now, there are still obstacles on the horizon including rising costs of production and a down ag economy. All sectors of animal agriculture are relying on tools from an outdated farm bill that may not provide the safety net needed for long-term sustainability. This jeopardizes not only the continuity of many farms in the United States, but their ability to continue growing the affordable food, fiber and renewable fuel that people throughout the world rely on.
