Record U.S. Agricultural Trade Deficit Forecasted to Keep Growing

Betty Resnick
Economist
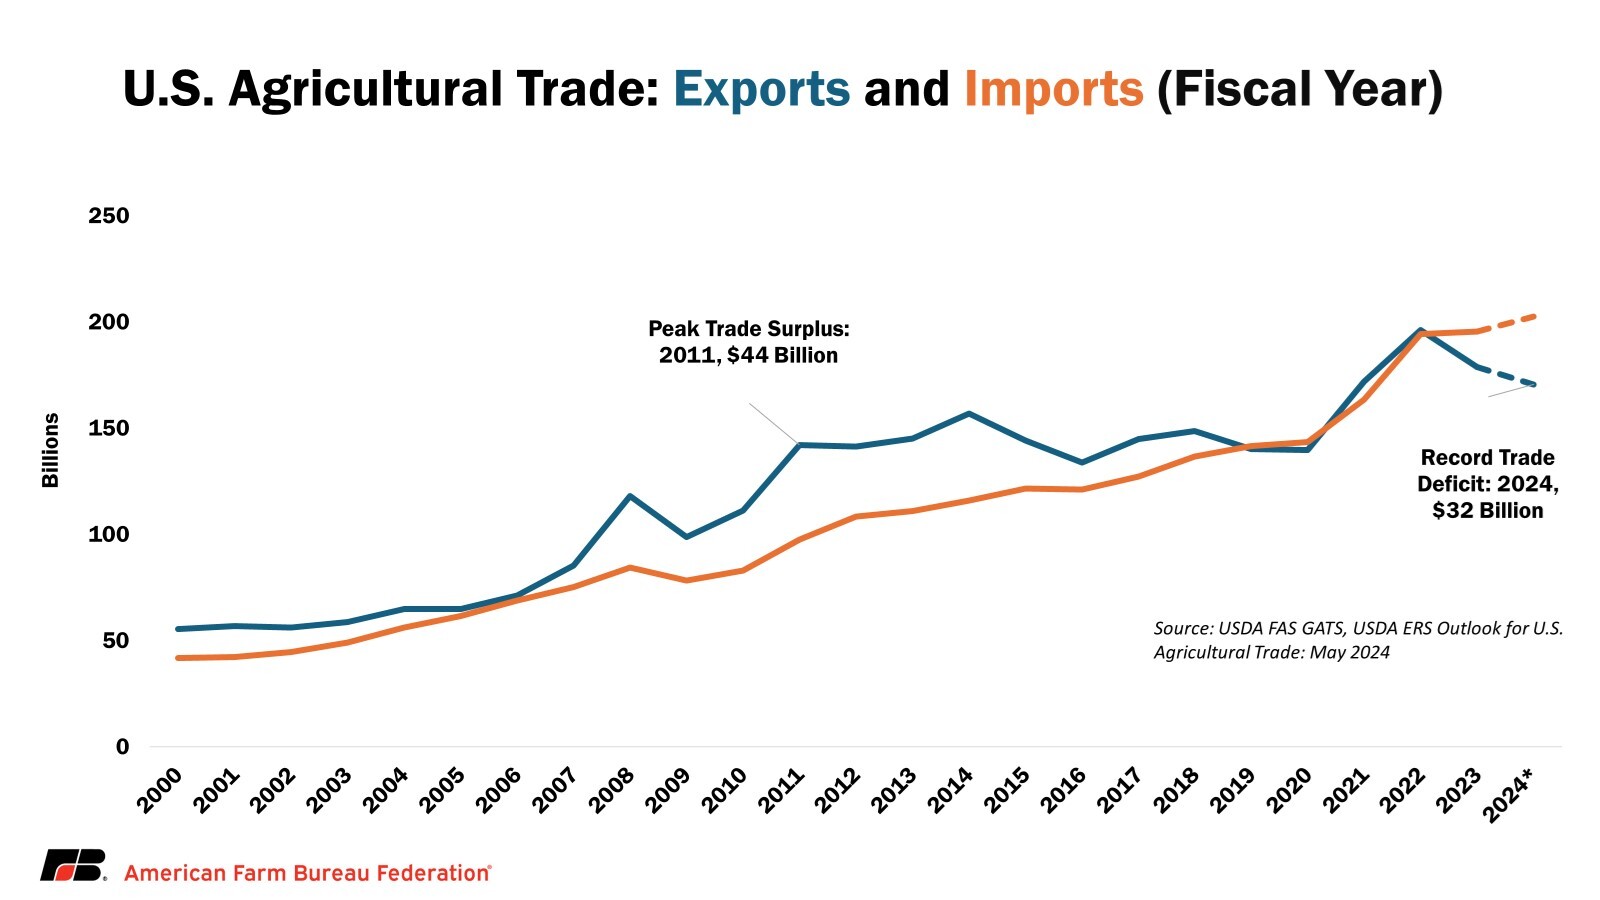
After decades of substantial U.S. agricultural trade surpluses, staggering agricultural trade deficits over the past two years have caught the nation’s attention. For fiscal year 2024 (October 2023 – September 2024), USDA’s Economic Research Service estimates that there will be a record $32 billion agricultural trade deficit. The fiscal year 2024 deficit follows the current record deficit of $16.7 billion set in fiscal year 2023 and would be only the fourth agricultural trade deficit in the last 50 years. This trend reversal leaves many people scratching their heads, but your American Farm Bureau Federation Economics team is here to help explain how we got here.
Background on Agricultural Trade Mix
Agricultural trade is essential to our nation’s food security, and benefits both farmers and consumers alike. Farmers find export markets eager to buy U.S. products that we grow in abundance such as grains, oilseeds, meat and more. Consumers have become used to eating fresh fruits and vegetables year-round, much of which would be impossible without imports from our southern trading partners. Many cannot live without their daily cup of coffee, a tropical import we do not grow in the continental United States. (Apologies to Hawaii and Puerto Rico, which combined grow approximately 0.2% of the coffee we consume).
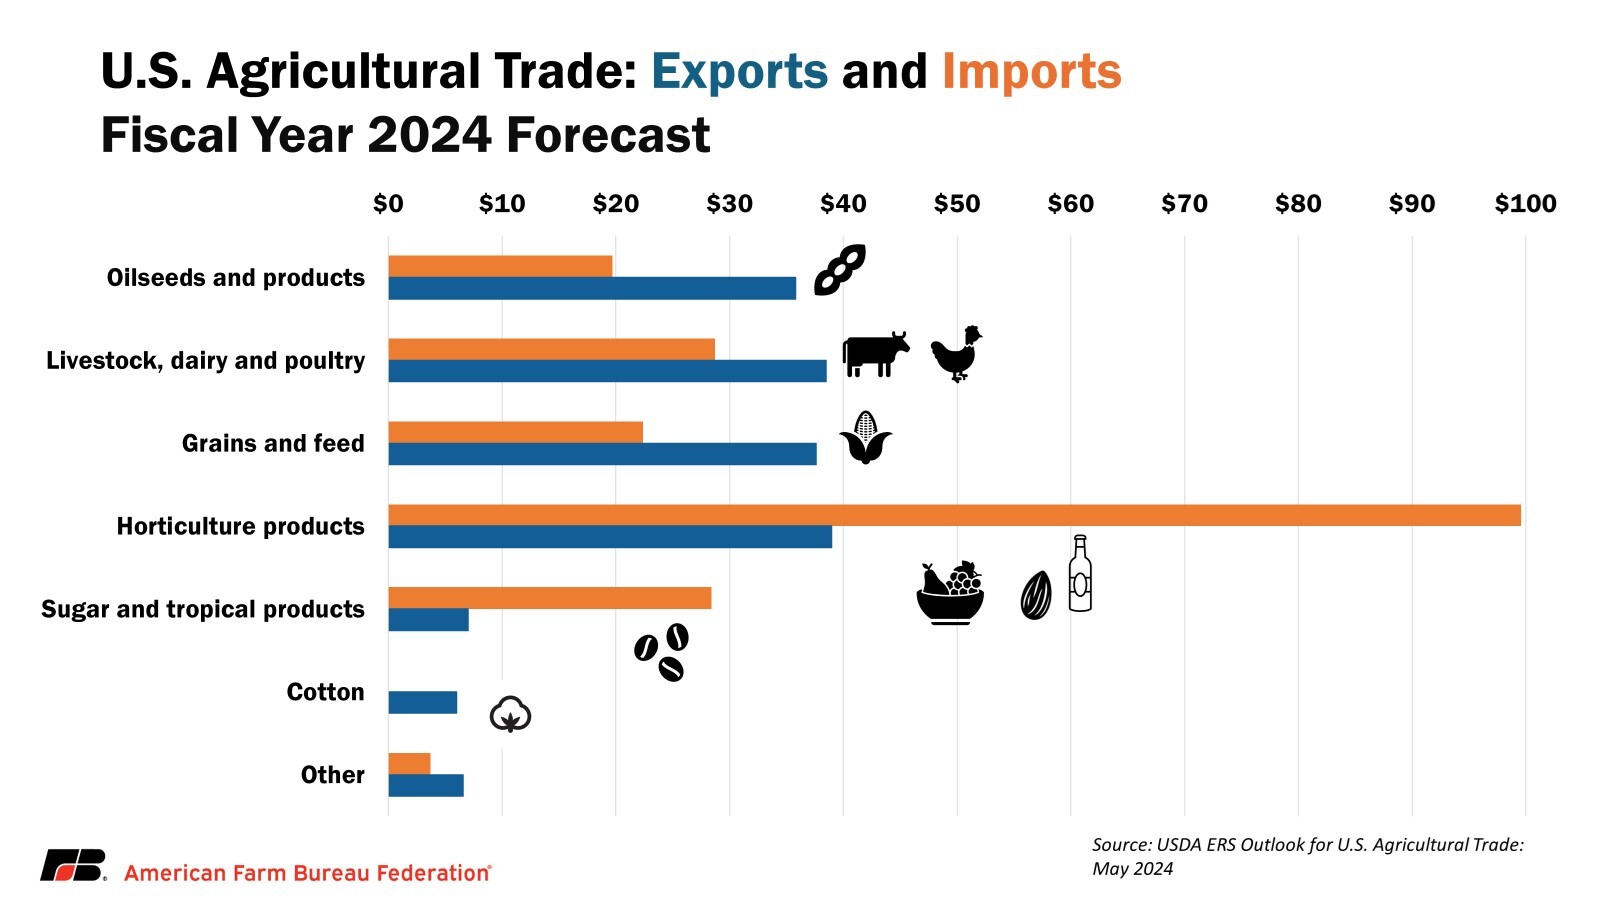
Some of our seasonal fruit and vegetable producers have been squeezed by imports from our southern neighbors; but much of what we import does not directly compete with domestic agricultural products, and some of those imports are value-added products produced with raw agricultural products exported from the U.S. In fact, 16% of total forecasted fiscal year 2024 imports consist of coffee, cocoa, distilled spirits and beer. Other imports complement U.S. domestic production. For example, much of the beef imported to the U.S. are lean cuts that are blended with fattier, U.S.-raised beef for desired levels of leanness in ground beef. Without imports of lean beef, U.S. ranchers who focus on growing the highest quality beef in the world for premium cuts for delicious steaks would miss out on the market demand for ground beef.
Rising Imports and the Challenges to U.S. Specialty Crops
The category with the largest trade deficit is horticultural products – predominantly made up of specialty crops including fresh fruits and vegetables. Accounting for 49% of all imports by value, it has increased by $22 billion (+31%) since fiscal year 2020. In part, the increase in horticultural products reflects a thriving U.S. economy. As real income per capita increases, consumers are demanding more fresh fruits and vegetables. This is also reflects the strong U.S. dollar and a focus on healthy diets.
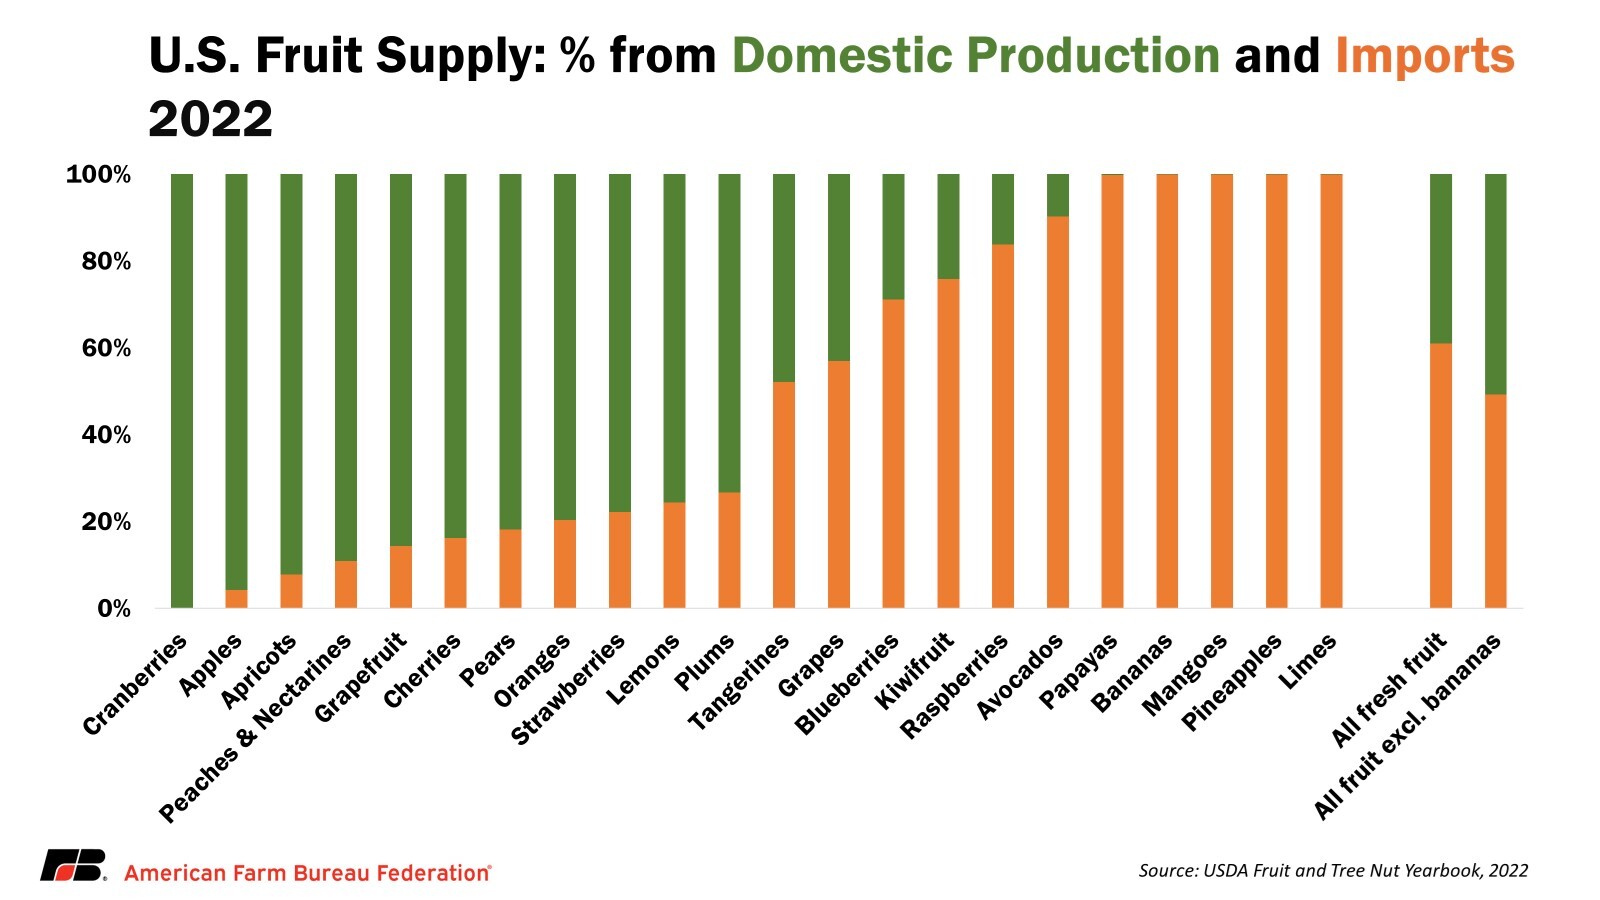
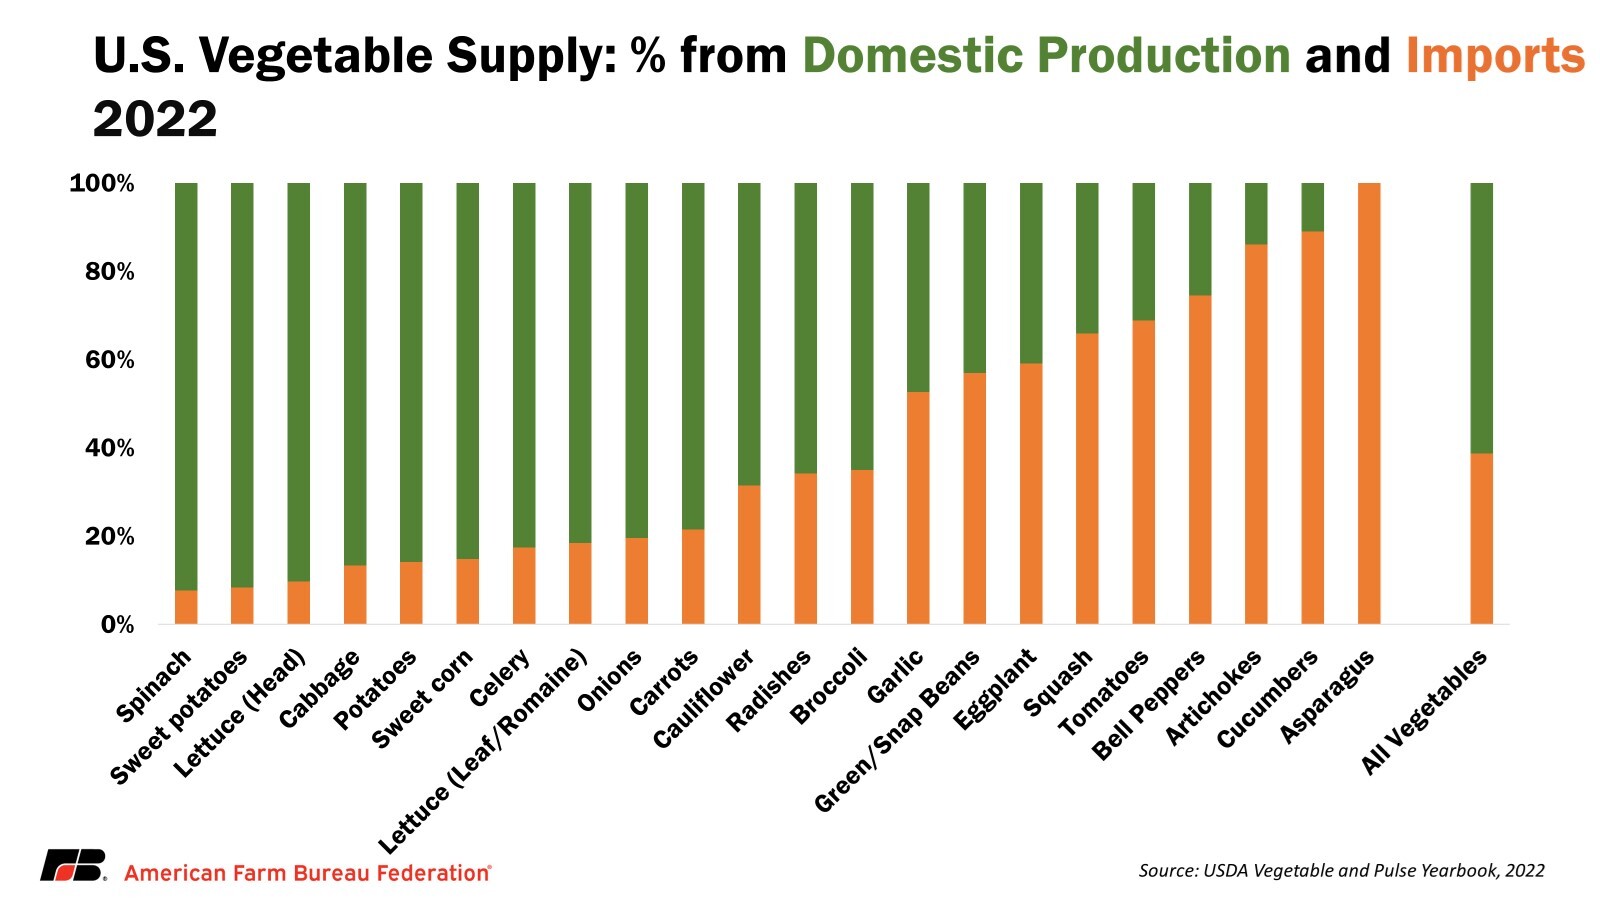
However, rising imports are both a cause and effect of the reduction in U.S. fresh fruit and vegetable production, which has declined in volume by 10% and 23.1%, respectively, since 2000. U.S. fresh fruit and vegetable production is declining due to a multitude of factors, including land loss due to urban encroachment, diseases such as citrus greening, and, probably most importantly, a lack of affordable and available farm labor. Production of many fresh fruits and vegetables is extremely labor intensive. For U.S. agricultural production broadly, labor accounts for about 10% of expenses. For fruit and vegetable production – labor costs account for 38.5% and 28.8% of input costs, respectively.
Seasonal agricultural producers have access to the H-2A temporary worker visa program, a generally reliable but pricy option to bring in workers from other countries. Farmers are increasingly using the H-2A visa program, under which 378,000 jobs were certified in fiscal year 2023 – three times the number certified only 10 years ago. With the H-2A visa program, producers must pay an hourly rate set by the government called the “Adverse Effect Wage Rate,” which is established regionally based on local rates for field and livestock workers. The AEWR has risen precipitously in recent years, climbing an average of 5.9% annually since 2019. In 2024, the national average AEWR is $17.55 per hour. In California, the largest fresh fruit- and vegetable-producing state, the AEWR is $19.75. In addition to the required AEWR, employers provide housing, food, transportation, visa fees, insurance and other expenses for every worker. At the same time, agricultural workers in Mexico are estimated to make almost the same amount in an entire day than for one hour of work in California paid at the AEWR rate.
While high labor costs are raising the cost of producing specialty crops domestically, increasing imports during the growing season are lowering prices and potential revenue for U.S. producers. Increasing costs and decreasing revenues make for an unprofitable business, and a further reduction in U.S. fruit and vegetable production. This is especially prevalent in the months just before and just after peak domestic production, when producers often made their highest profit margins.
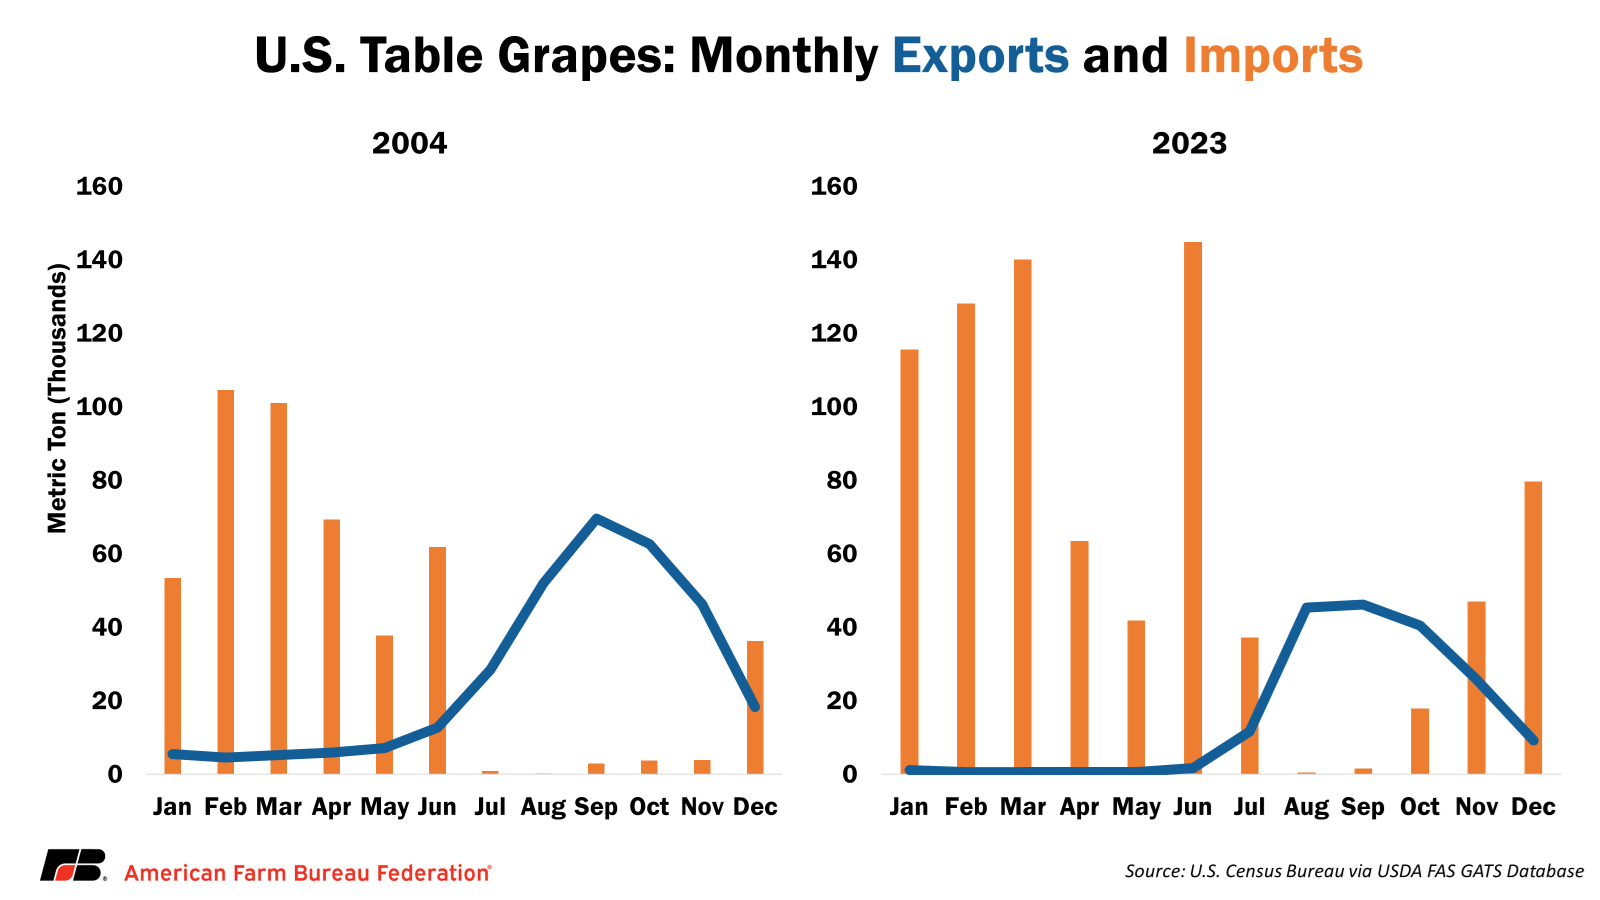
This phenomenon is demonstrated below in the U.S. table grape industry, i.e., the grapes you eat. Over 99% of all U.S. table grapes are grown in California and they are available in stores from May to January. While in 2004 only 2% (11,200 MT) of all table grape imports occurred between July and November, in 2023 the share had grown to 13% (104,000 MT). For the shoulder months of July, October, and November – imports have grown an overwhelming 1,126%! Compared to 2004, U.S. table grape production is roughly the same, but between marketing years 2018/19 and 2022/23, production declined by 19%.
Decreasing U.S. Exports
Two major factors have contributed to the decline of the value of U.S. exports since 2021: falling commodity prices and the strong U.S. dollar. As corn and soy prices fell, the export value naturally decreased. The strong U.S. dollar is making U.S. products less competitive on currency exchange alone. For instance, Japan is consistently a top-5 market for U.S. agricultural products. The Japanese yen is the lowest it has been against the U.S. dollar since 1990 and half of its value from only 12 years ago, in 2012. While this exchange rate is great for U.S. tourists visiting Japan, it is very difficult for Japanese consumers seeking to purchase quality U.S. products.
Worryingly, U.S. corn and soybean export quantity has not picked up in conjunction with declining commodity prices, which fell by 30% and 12% respectively between fiscal years 2023 and 2024. U.S. grain and oilseed exports are seeing headwinds from rising competition from Brazil. Efforts by China to become less dependent on agricultural imports from the U.S. are also having an impact. In fact, fiscal year 2024 is forecasted to be the first year that Mexico is the top destination for U.S. agricultural exports. There is also a growing trade deficit in animal fats and vegetable oils spurred by rapid market- and policy-driven growth demand for feedstocks for renewable diesel production.
It does not help that the U.S. has not entered any new free trade agreements with new trading partners since 2012. At the same time – the rest of the world has continued to sign more FTAs. The Comprehensive and Progressive Agreement for Trans-Pacific Partnership (CPTPP), formed by the other partners in the aftermath of the U.S. abandoning the negotiated but unratified Trans-Pacific Partnership, is quickly slashing tariffs for other exporters in major U.S. export markets on the Pacific Rim and causing U.S. market shares to shrink for products ranging from frozen fries to blueberries to pet food.
The Market Access and Foreign Market Development (MAP and FMD) programs are one way that USDA supports agricultural exports by providing matching funds to industry groups that promote U.S. agricultural products abroad. MAP and FMD funding have not been increased since 2006 and 2002, respectively. Using Commodity Credit Corporation dollars, USDA in 2023 introduced $1.2 billion in Regional Agricultural Promotion Program (RAPP) spending that works similarly to the MAP/FMD programs, but limits spending to markets outside of the top U.S. agricultural export destinations (i.e., excludes China, Mexico, Canada and the European Union). Both the farm bill passed through the House Committee on Agriculture and the farm bill proposal from Senate Agriculture Committee Ranking Member Sen. Boozman seek to double MAP/FMD funding.
Conclusion
Fiscal year 2019 was the first U.S. agricultural trade deficit going back to a least 1967. We have subsequently faced an agricultural trade deficit in four of six years, with a record $32 billion deficit forecasted in fiscal year 2024.
In aggregate, we import and export complementary products, so that a trade deficit in agricultural products is not inherently a problem. However, the expanding trade deficit reflects some serious challenges imposed on U.S. agriculture, including lower commodity prices, stress in domestic specialty crop production, and less competitive access to many traditional U.S. export markets, among other factors.
Policy changes to stem rapidly increasing farm labor costs, increase exports by negotiating lower tariffs and better market access, and more international market promotion funding could help return the U.S. to agricultural trade surpluses.
