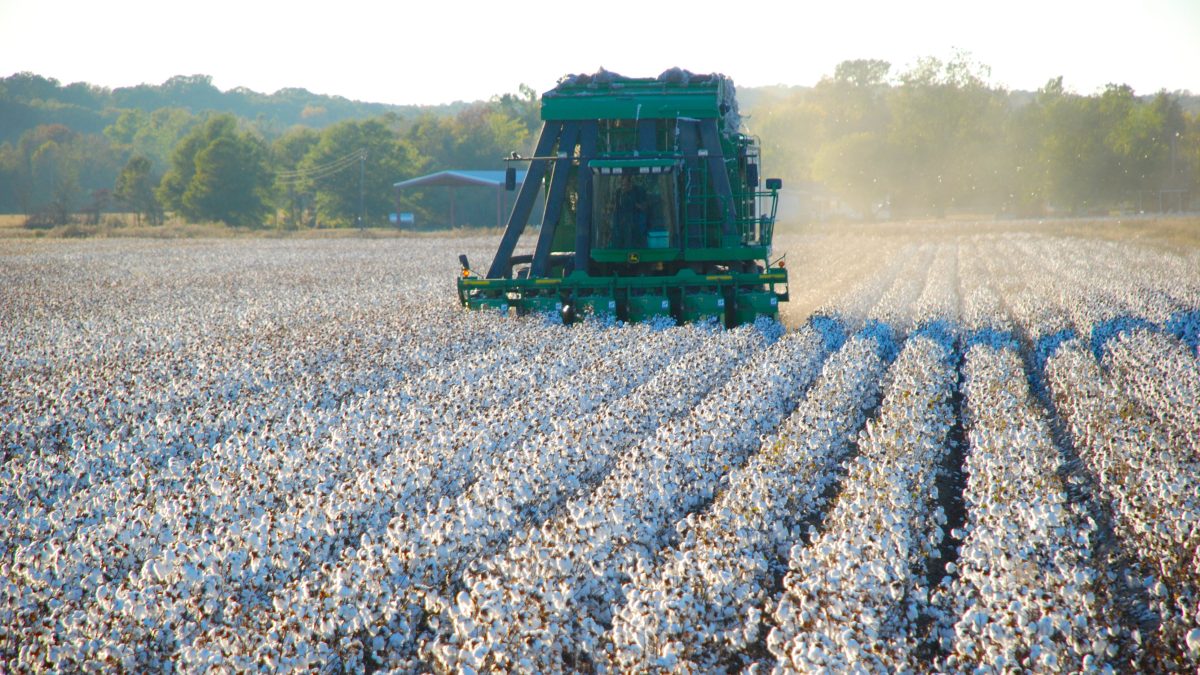
Reviewing 2019 Crop Insurance Coverage

photo credit: Arkansas Farm Bureau, used with permission.
John Newton, Ph.D.
Chief Economist
During 2019, nearly 86 million acres of corn, 13 million acres of cotton and 70 million acres of soybeans were covered by crop insurance, accounting for approximately 95% of corn acres and cotton acres and 92% of soybeans acres planted in the U.S. Collectively, farmers paid more than $2.3 billion to cover these crops under crop insurance.
The most popular insurance election by growers is the revenue protection policy with the harvest price option. Seventy-nine million acres of corn, 11 million acres of cotton and 65 million acres of soybeans were covered by these RP policies. Harvest price option policies have an indemnity function that utilizes the maximum of the spring or harvest price to determine if a farm has suffered a loss and may assist growers by indemnifying at the replacement value of the crop (if the harvest price is greater than the spring price).
Spring prices for corn, soybeans and cotton are determined by averaging the new-crop futures contract settlement prices (December for corn and cotton, November for soybeans) during the month-long February price discovery period. Harvest prices are determined by averaging the same new-crop futures during the month-long October price discovery period. The spring prices announced in March 2019 were $4.00 per bushel, 73 cents per pound and $9.54 per bushel, respectively, for corn, cotton and soybeans. At the beginning of November, USDA’s Risk Management Agency announced the harvest prices for corn, cotton and soybeans at $3.90 per bushel, 63 cents per pound and $9.25 per bushel, respectively.
For corn, the harvest price was 10 cents per bushel below the spring price and marks the seventh consecutive year that harvest prices have been below the spring prices established in February. For cotton, the harvest price was 10 cents per pound below the spring price and matches the prior low of 63 cents in 2015. For soybeans, the harvest price was down 29 cents per bushel but was up 65 cents from the prior-year. Spring and harvest prices are presented in Figure 1.

Crop Insurance Triggering Yields
For 2019 corn, cotton and soybean policyholders, the crop insurance guarantee will be based on the higher spring prices of $4.00 per bushel, 74 cents per pound and $9.54 per bushel, respectively. When the harvest price is below the spring price, yield declines do not need to be as large to trigger indemnities because a portion of the revenue decline is attributable to price and not yield.
One way to measure the yield decline needed to trigger crop insurance is an implied coverage level multiplier. Coverage level multipliers, defined as the maximum of the spring price and the harvest price divided by the harvest price, boost yield coverage when the spring price is greater than the harvest price. When the harvest price is greater than the spring price, coverage level multipliers equal zero. For 2019 corn policies, the coverage level multiplier is equal to 103%, i.e., 1.03 = 4.00÷3.96. For 2019 cotton policies, the coverage level multiplier is equal to 116%, i.e., 1.16 = 0.73÷0.63. For 2019 soybean policies, the coverage level multiplier is equal to 103%, i.e., 1.03 = 9.54÷9.25. Coverage level multipliers for corn, cotton and soybeans policies are presented in Figure 2.

The coverage level multipliers can then be multiplied by the declared coverage level to determine how far actual yields need to fall below the APH yield to trigger indemnities. For example, using the 2019 coverage level multipliers, both corn and soybean crop insurance policies with an 80% coverage level will trigger an indemnity when the actual yield is less than 82% of the APH yield, i.e., 0.82 = 1.03 X 0.80. For cotton, an indemnity will trigger at 80% coverage when the actual yield is less than 93% of the APH yield. In all examples, a grower must experience a crop loss relative to the APH to receive an insurance indemnity. Figure 3 highlights the yield declines, relative to the APH, needed to trigger crop insurance at the 80% coverage level.

Summary
Given the adverse growing conditions experienced this year across the U.S., USDA is projecting national average corn yields will fall by 5%, soybean yields will decline by 7% and cotton yields will drop by nearly 4%. Lower projected yields combined with lower crop prices this harvest will reduce actual farmer revenues in 2019. To help manage this revenue risk, a large majority of farmers purchase revenue-based crop insurance policies.
Due to lower crop prices, lower yields and record-high prevented plantings, USDA’s current projection is for federal insurance indemnities for all crops and livestock in 2019 to total $10.5 billion. If realized, crop insurance indemnities in 2019 would be the highest since the drought-impacted years of 2012 and 2013, and the third highest over the last decade.