Tallying Up the Latest Retaliatory Tariffs

Betty Resnick
Economist
Trade has become a hot topic this year, with a lot of uncertainty. Trade policy decisions being made in Washington will impact farmers and ranchers in the countryside. This Market Intel report is part of a series exploring different topics related to agricultural trade, including the potential impacts of trade policy changes and Agricultural Exports 101.
Tariffs can be a double-whammy for farmers. Farmers not only end up paying more for inputs, they also often take the brunt of retaliatory tariffs. With over 20% of U.S. agricultural goods exported, retaliatory tariffs can pose a major threat to farmers’ ability to turn a profit. The most recent rounds of U.S.-imposed tariffs, and subsequent retaliation, are no different. The three top countries targeted for tariffs to date: Mexico, Canada and China, are also our top three markets for agriculture exports at $30.3 billion, $28.3 billion and $24.7 billion, respectively, in 2024.
Retaliatory Tariffs in Effect as of March 18, 2025
The imposition of tariffs on imports to the U.S., and subsequent retaliatory measures by other governments, is occurring so rapidly that it’s hard to keep track of which tariffs have been announced, which have been paused, and which are in force from our own government – let alone from our many trading partners.
From Inauguration Day through March 18, 2025, an additional 20% of tariffs have been applied to all Chinese products, 25% to most Canadian and Mexican products (which were subsequently paused through April 2 on USMCA-compliant products) and 25% to all steel and aluminum imports from all countries.
Canada and China have already implemented retaliatory tariffs in response to U.S.-imposed tariffs. The European Union also recently announced that they plan on imposing tariffs on U.S. products in April.
Canada Retaliatory Tariffs – Tranche I
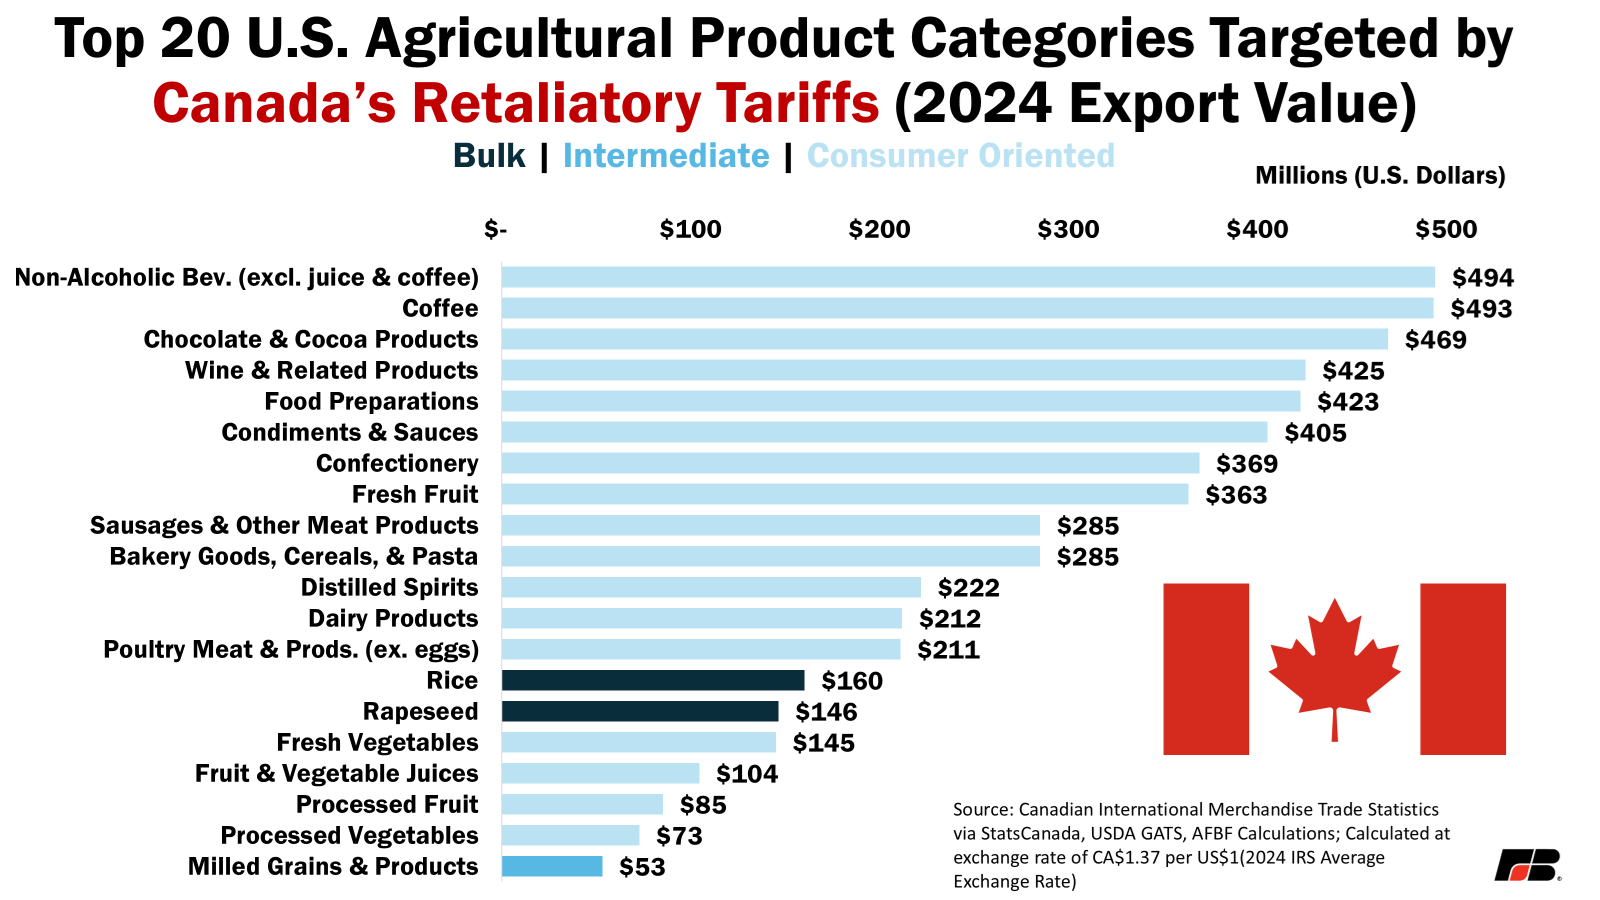
In 2024, Canada was the second-largest destination for U.S. agricultural products by value. Effective March 4, the date a 25% tariff on all Canadian products (excluding energy, which received a 10% tariff) went into effect, Canada imposed a 25% tariff on roughly $21 billion (CA$30 billion) of U.S. products. Over a quarter of the retaliatory tariffs are on a total of $5.8 billion of U.S. agricultural products, according to Canadian trade value statistics for 2024.
On a value basis, several processed food products including chocolates and other confectionery products are the most impacted, along with coffee. Additionally hard-hit U.S. agricultural products include $425 million in wine, $363 million of fresh fruit, $212 million of dairy products, $211 million of poultry and $160 million of rice. On a percentage of exports basis, watermelons are among the most impacted products. In 2024, 97% of our country’s $114 million in watermelon exports were shipped north to Canada.
Canada has vowed to go dollar-for-dollar with U.S. tariffs and is currently seeking comment on which products should be included in an additional round of tariffs on approximately $87 billion worth of U.S. exports. It is likely that this second tranche of exports will cover all U.S. agricultural exports to our northern neighbor. Canada also announced an additional set of tariffs on March 12 on approximately $21 billion of U.S. exports in response to the U.S. steel and aluminum tariffs, but the list did not include any agricultural products.
China Retaliatory Tariffs
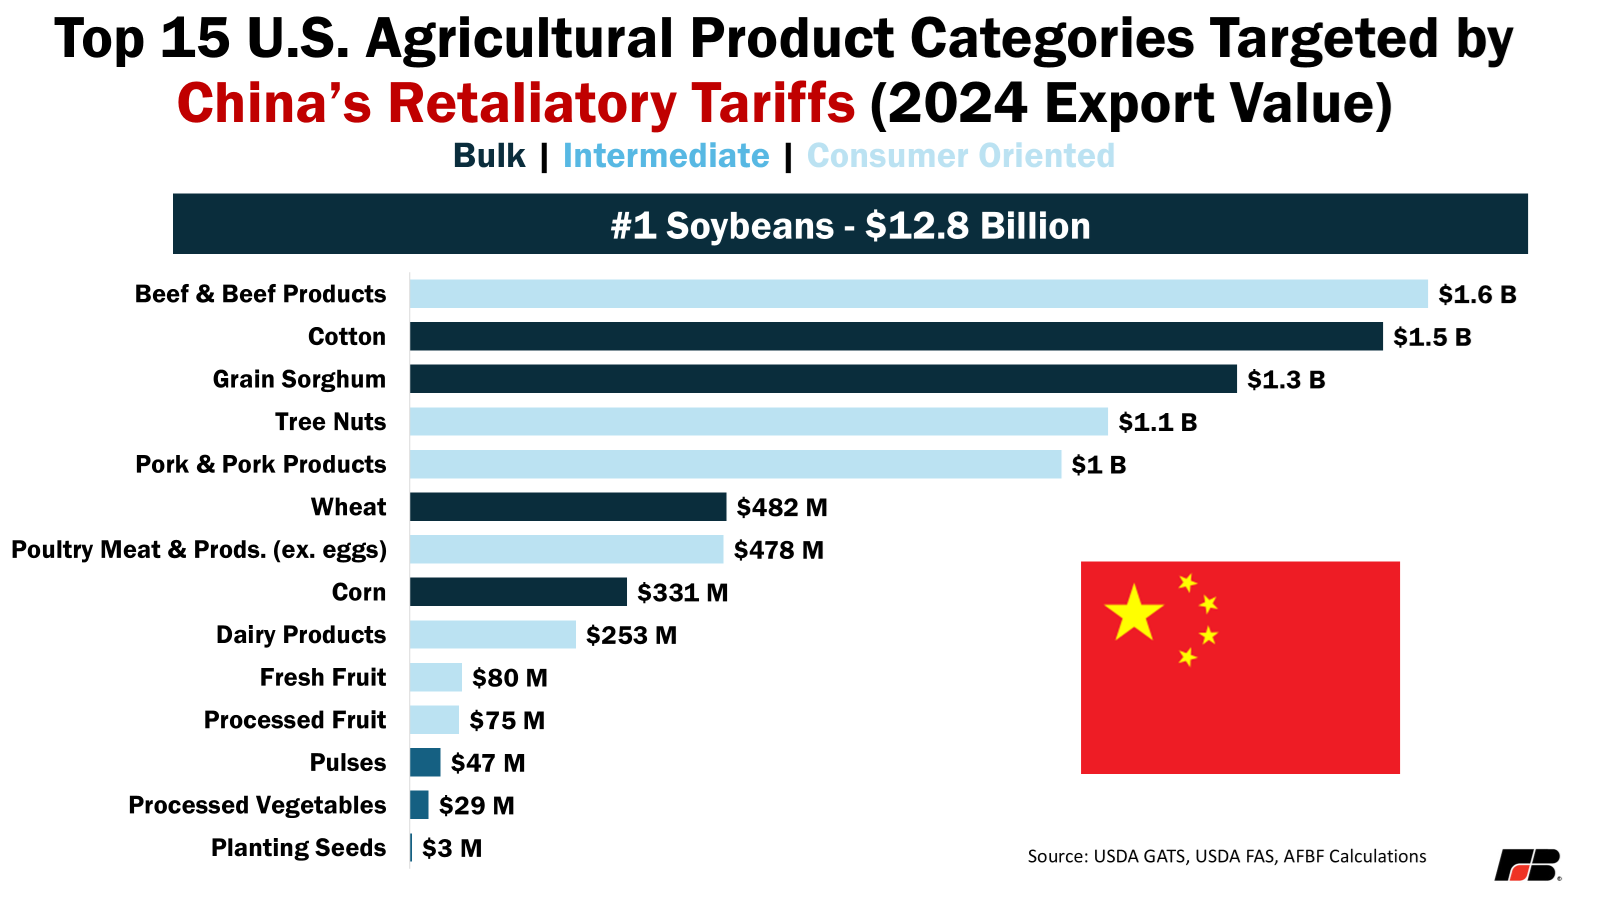
While agricultural products escaped the first round of China’s retaliatory tariffs, they were squarely targeted in the second round, which went into effect for products shipped out of the U.S. after March 10 and that have not arrived in China by April 12. An additional 15% tariff was added for chicken, wheat, corn and cotton and a 10% tariff was placed on a huge swath of agricultural products, including sorghum, soybeans, pork, beef, fruits, vegetables and dairy products. In total, China, our third-largest agricultural export destination in 2024, placed additional tariffs on approximately $21 billion of U.S. product based on 2024 export data (not including tariffs on seafood and forestry products).
The top five products impacted, in terms of value of 2024 exports, are soybeans ($12.8 billion), cotton ($1.5 billion), grain sorghum ($1.3 billion), frozen boneless bovine meat ($1 billion) and in-shell pistachios ($627 million). China has made up a quarter or more of U.S. global agricultural exports for 10 targeted products over the last five years: macadamia nuts (99%, $12 million), frozen swine carcasses (96%, $25 million), grain sorghum (88%, $1.3 billion), frozen swine offal (75%, $593 million), soybeans (53%, $12.8 billion), frozen unboned hams, shoulders and cuts thereof (45%, $7 million), in-shell hazelnuts (38%, $8 million), cotton, not carded or combed (29%, $1.5 billion), frozen boneless bovine meat (27%, $1 billion) and in-shell pistachios (25%, $627 million).
Notably, nearly all (97%) of the targeted products (HS codes) were already subjected to retaliatory tariffs of upwards of 55% dating back to April 2018 (Section 232 Retaliation) and February 2020 (Section 301 Retaliation).
Impacts on Agriculture
It is too early to measure the full impact on American agriculture of the retaliatory tariffs currently in place, or that of the additional retaliatory tariffs that are likely to be implemented shortly by Canada and the EU. We do know, however, that tariffs (and subsequent increased consumer prices) will certainly decrease demand for U.S. products in our second- and third-largest agricultural export markets. Farmers do not get to set their own prices and are subject to the whims of these markets. All they can do is plant a good crop, tend to it, pray for good weather, and hope to make a profit after harvest.
Methodology Note: Tariffs are placed on products based on Harmonized System (HS) Codes. Globally, HS Codes are harmonized at the six-digit level. Both China and Canada placed tariffs on the U.S. at the 8-digit level and 10-digit level, respectively, which are unique to each nation. Analysis of Canada’s tariffs was done using Canadian-reported imports from the U.S. and an exchange rate for 2024 of CA$1.37 Canadian per U.S. dollar. The Canadian HS Codes were matched to U.S.-defined agricultural categories at the six-digit level.
Impact of Chinese tariffs were calculated using U.S. Census Bureau trade data via USDA GATS and matched at the six-digit level. For nearly all products, all ten-digit HS Codes were included for each six-digit category. An exception was soybeans, though most soybeans exported to China are under impacted H.S. codes, according to the American Soybean Association. The use of trade data at the six-digit level may lead to a slight overestimation of the impact of China’s retaliatory tariffs on U.S. products.