The 2017 Census of Agriculture, Our First Take
Veronica Nigh
Former AFBF Senior Economist
The 2017 Census of Agriculture was released last week to much-deserved fanfare. The Census of Ag is a herculean effort undertaken by USDA every five years by a staff of dedicated professionals intent on asking the right questions, in the right way, in order to paint the most accurate picture of U.S. agriculture at the time the data is collected. One small point of reference to highlight how seriously USDA takes the Census of Agriculture - the response rate for the 2017 Census of Agriculture was 71.8 percent. Many studies have been conducted regarding survey response rates. The following response rates are common, according to the Center for Innovation in Teaching and Research: customer and member surveys – 5 to 40 percent; general public – 1 to 20 percent. The Census of Agriculture would likely be described as a hybrid of these two types. But by either definition, USDA’s doggedness for collecting responses is clearly impressive. The survey results will be the source of research and discussion for years to come; we dig into some of the high-level results here.
Number of Ag Acres
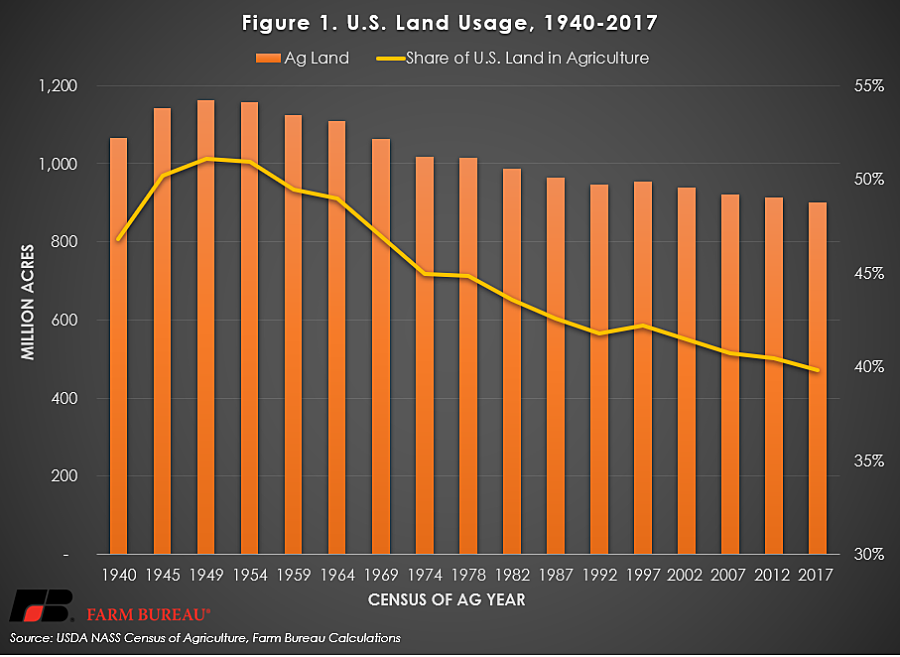
There are 2.26 billion acres in the United States. Between 2012 and 2017, the number of acres of land in farms fell by 14.3 million acres or 1.6 percent to 900 million acres. That means that in 2017, 40 percent of land in the U.S. was producing food and fiber for U.S. and non-U.S. citizens alike. This is the lowest share of U.S. land dedicated to agricultural use since the 1910 Census of Agriculture. For those who will inevitably wonder which year had the highest share of land dedicated to agricultural use – it was 1950, with 51.1 percent of land in farms. (In 1935, the Census reported that 55.4 percent of land was dedicated to agriculture, but this data point is excluded because it occurred before the United States was remeasured in 1940.)
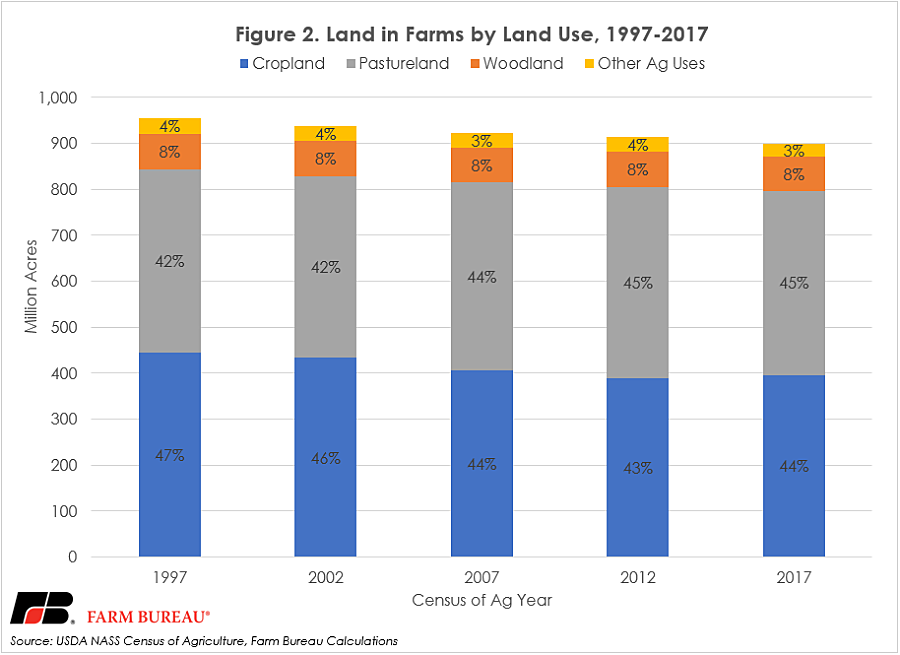
USDA further breaks down ag land into four different uses: cropland, woodland, pastureland and other including farmsteads, homes, buildings, livestock facilities, ponds, roads, wasteland, etc. Here we see interesting shifts. Between 2012 and 2017, acreage in cropland was the only segment to increase, up 6.7 million acres. The largest decline was in pastureland/rangeland, which was down 14.5 million acres. Acreage in woodland and other ag uses also declined, by 3.9 million acres and 2.5 million acres, respectively. However, despite these changes, the share of ag land dedicated to different uses has remained fairly consistent over the last 20 years, as highlighted in Figure 2.
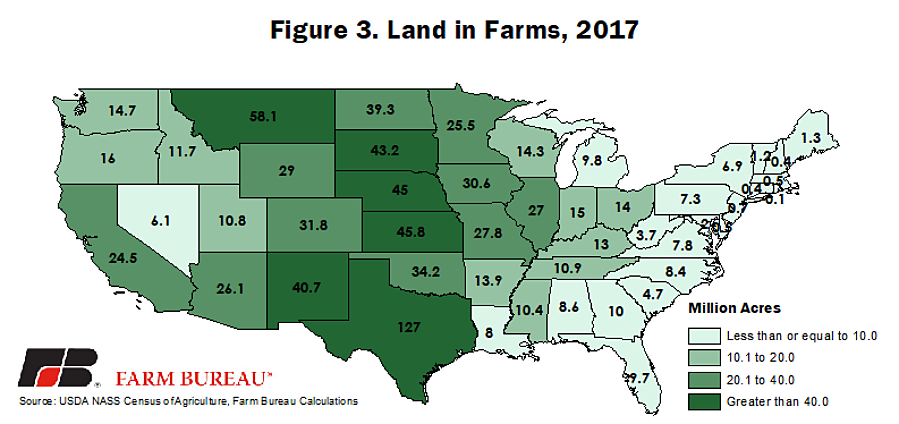
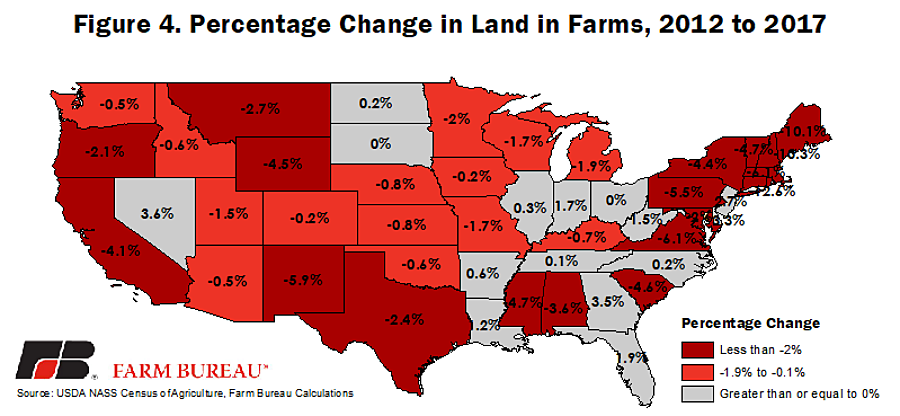
Moving into state-by-state analysis, figure 3 visualizes the number of acres in ag land in each state, while figure 4 demonstrates the change in ag land by percentage between 2017 and 2012. Texas (-3.1 million), New Mexico (-2.5 million), Montana (-1.6 million), Wyoming (-1.3 million) and California (-1 million) lost the largest number of farmland acres. Five states in the Northeast saw the largest declines in ag land on a percentage basis. Between 2017 and 2012, Rhode Island lost 18 percent of its ag land, followed by Connecticut (-13 percent), New Hampshire (-10 percent), Maine (-10 percent) and Massachusetts (-6 percent). Meanwhile, other states added ag land. Georgia (+332 thousand), Indiana (+249 thousand), Nevada (+214 thousand), Florida (+183 thousand) and Louisiana (+96 thousand) gained the largest number of farmland acres.
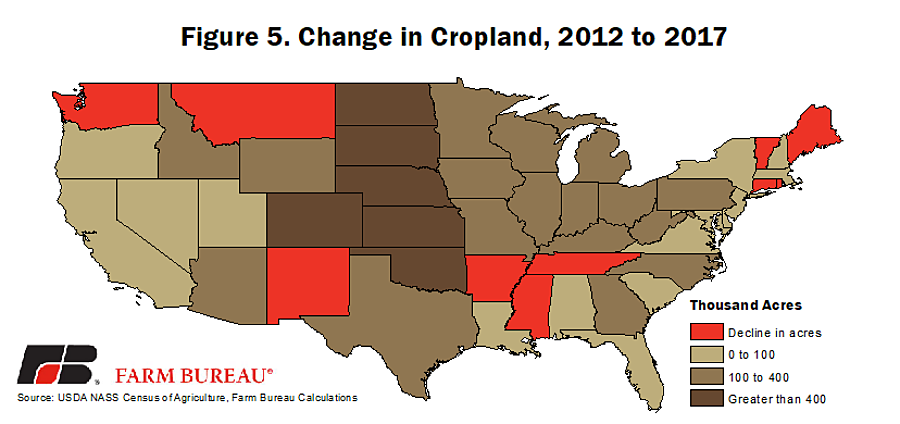
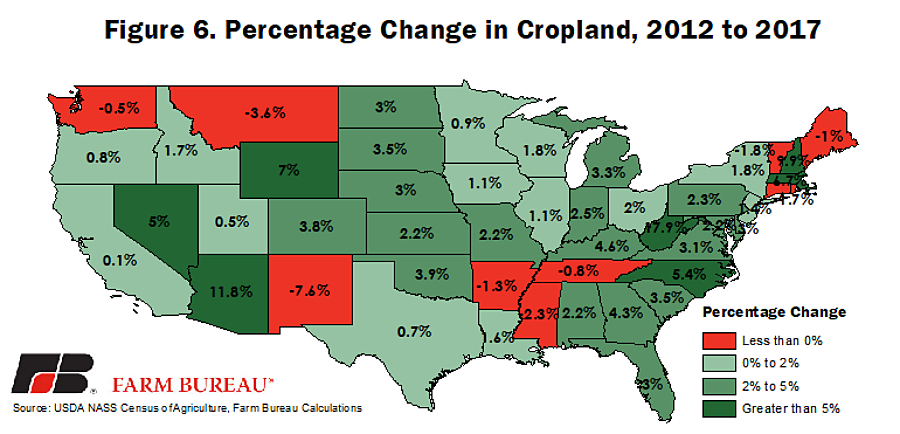
When the data by category is further disaggregated it is easy to see that different trends impacted the number of acres in different states. Within the cropland category, North Dakota (804 thousand), South Dakota (666 thousand), Nebraska (645 thousand), Kansas (622 thousand) and Oklahoma (436 thousand) had the largest increase in crop acreage. Montana (-615 thousand), New Mexico (-150 thousand), Mississippi (-114 thousand), Arkansas (-105 thousand) and Tennessee (-43 thousand) experienced the largest number of declining crop acreage. On a percentage basis, Rhode Island, New Mexico, Montana, Mississippi and Vermont had the largest decline, while West Virginia, Arizona, New Hampshire, Hawaii and Wyoming had the largest percentage increase.
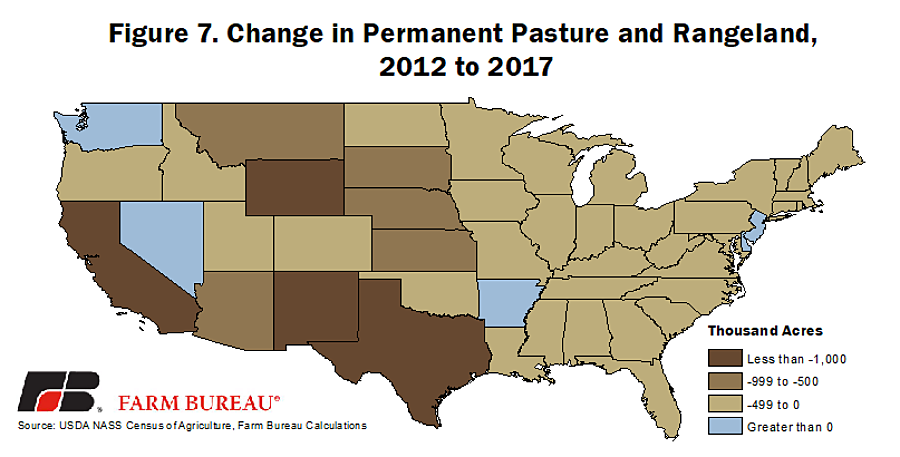
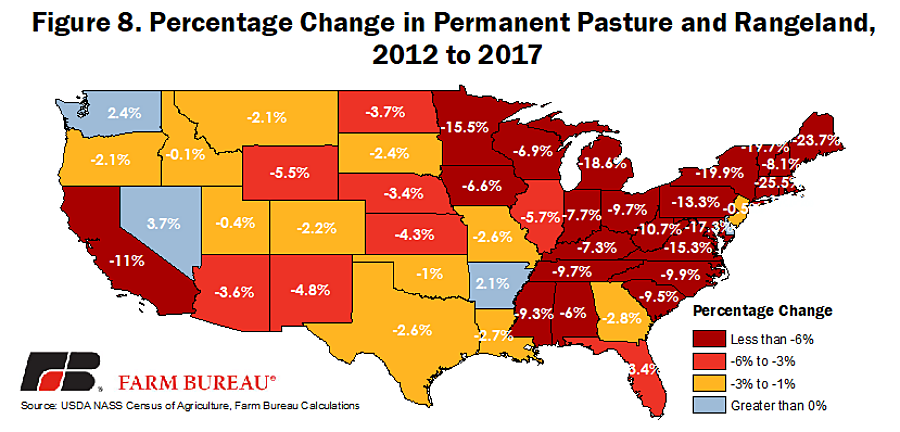
Within the pasture and rangeland category, Texas (-2.3 million), New Mexico (-1.8 million), Wyoming (-1.5 million), California (-1.4 million) and New Mexico (-0.8 million) experienced the largest number of declining permanent pasture acreage. On a percentage basis, Massachusetts, Maine, New York, Connecticut and Vermont showed the largest declines. Nevada (171 thousand), Washington (110 thousand), Arkansas (65 thousand) and Alaska (18 thousand) had the largest increase in pasture and rangeland on both an acreage and percentage basis.
Farm Production Expenses
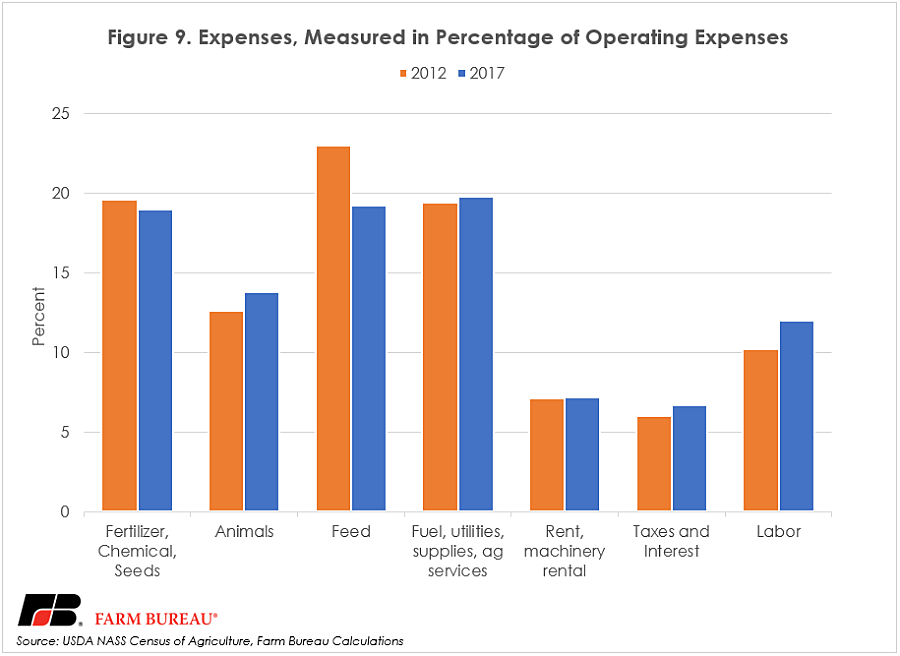
Overall farm production expenses decreased by $2.5 million, a decline of 0.8 percent. This figure was primarily driven down by a 17 percent decline in feed costs, a 19 percent decline in fuel costs and an 18 percent decline in fertilizer costs. However, not all expense areas trended in the same direction. Hired labor expenses increased by $4.7 million, an increase of 17 percent; taxes increased by nearly $1.9 million, an increase of 25 percent and animal prices increased by almost $3.6 million, a 9 percent increase. In figure xx we group the 17 Census of Ag categories into seven categories.
Number of Farms by Size Category
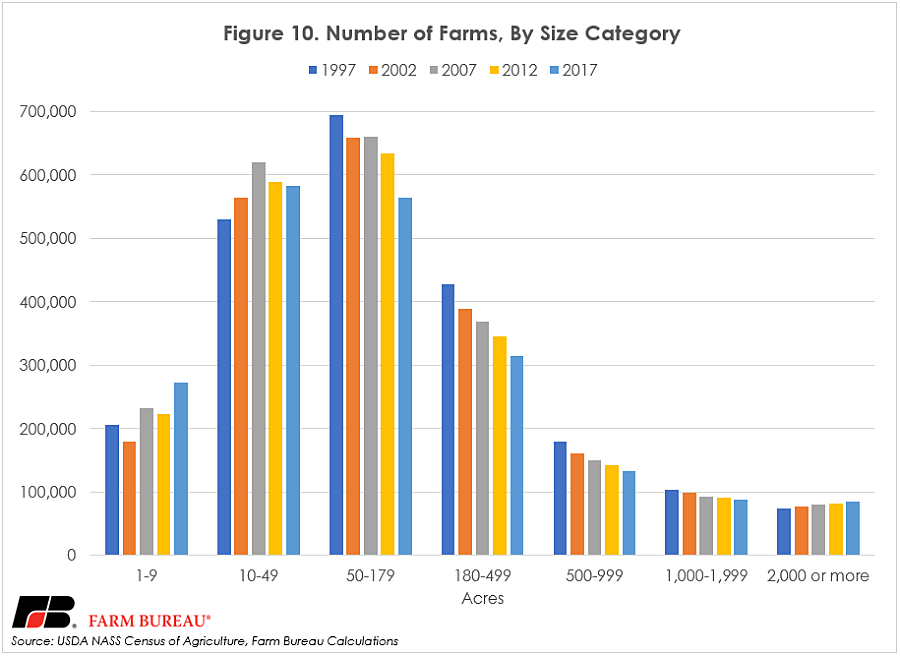
The number of farms declined in every size category except 1-9 acres and 2,000 acres or more in the 2017 Census of Agriculture. And while the number of farms that were 2,000 acres or more only increased by 2,920 farms, an increase of 3.6 percent, the role of those larger operations continues to grow. The fewest number of farms, accounting for 75 percent of the market value of agricultural products sold in 2017, fell to a little over 105,000 farms. To put that number in context, there were 2.04 million farms identified in the 2017 Census.
Environmental
No-till practices are now the most common tillage technique on cropland in the United States, after an 8 percent increase in 2017 as compared to 2012. Following are no-till are conservation tillage techniques, increasing by 28 percent. Finally, conventional tillage practices were utilized on nearly 25 percent fewer acres in 2017.
Beyond tillage techniques, the 2017 Census highlights that farmers are embracing a wide variety of environmental practices. Farmers increased the number of acres of cropland planted to a cover crop by nearly 50 percent. Further, the number of operations with renewable energy devices increased by 132 percent. This huge increase was driven by large increases in the number of operations with solar panels, wind turbines, methane digesters and geo-exchange systems.
Demographics
USDA made changes to the 2017 Census of Agriculture to better capture all people involved in a farming operation. One change related to verbiage. In the 2017 Census, USDA asked about involvement of “producers” rather than “operators” in order to more fully reflect the various roles that different people on the farm might play. In the 2017 Census, USDA also allowed survey respondents to designate more than one person as a principle operator. New questions were also added in order to more fully capture all persons making decisions for the farm or ranch. These are just a few of the changes, but they highlight the effort of USDA to increase the inclusivity of the survey.
The result of these changes is that despite a decline of 3.2 percent in the number of farms, the number of producers increased by 6.9 percent, largely because more farms identified multiple producers. Most of these newly identified producers are female, which gives USDA a much clearer picture of the role women play on America’s farms and ranches.
The additional areas of decision making and ability to designate multiple principle operators also provide a clearer image of the role of younger producers (35 years old or younger). Further, the 2017 Census added questions about new and beginning producers (10 years or less on a farm). These changes add richness to the census results.
Conclusion
With over 6.4 million data points, the Census of Agriculture is a rich source of data, which we will be combing through and analyzing for years to come.
What We're Saying
Top Issues
VIEW ALL