Unfilled Railroad Grain Car Orders Persist into 2023
photo credit: Getty
Daniel Munch
Economist
Weather and Labor Continue to Challenge Railways
As shared in an October 2022 Market Intel, third quarter domestic rail service data indicated improvements in average rail speeds, unfilled grain car orders and employment numbers. A dive into the most recent data from the Surface Transportation Board, the independent agency tasked with economic regulation of freight rail, reveals an unexpected increase in the unfilled order metric for some Class I railroads, which continues to hinder farmers’ and ranchers’ abilities to move inputs and products efficiently and cost effectively. Other statistics send more positive signals on the domestic supply chain as transportation networks aim for pre-pandemic normalcy.
Total grain rail cars loaded and billed increased in the final quarter of 2022 from 321,000 cars in quarter three to 402,000 cars in quarter four. Over the past three years, volumes of grain rail cars have ranked the highest in the fourth quarter of the year, a trend that persisted in 2022 likely because of post-harvest demand. However, compared to the last quarter of 2020 and 2021, fewer grain rail cars were loaded at the end of 2022 (2% fewer than quarter four 2021 and 6% fewer than quarter four 2022). Burlington Northern and Santa Fe Railway (BNSF) and Union Pacific Railroad (UP), railroads that together processed 65% of all grain rail cars in quarter four 2022, shipped 6% and 5% fewer grain rail cars than the same period in 2021, respectively.
Much attention of late has been given to the Norfolk Southern (NS) derailment in East Palestine, Ohio. NS generally manages about 8% of the grain rail car movements across the country annually and is particularly important to farmers east of the Mississippi River. During the first eight weeks of 2021 and 2022 NS loaded and billed an average of 2,500 grain cars a week. During the first eight weeks of 2023, NS processed an average of 2,880 grain cars a week (a 10% increase). Though uncertainty remains regarding the derailment’s environmental impact on local communities, it has not appeared to impact the volume of grain cars being transported.
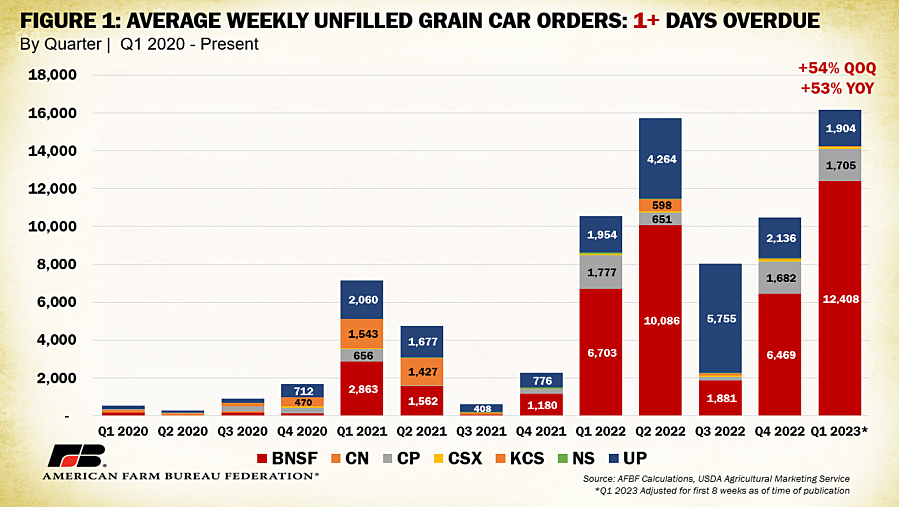
A look at weekly unfilled grain car orders, a metric that tracks grain cars not effectively loaded and billed, reveals some shippers are still facing challenges in getting access to rail car capacity. As a reminder, each railroad reports its definition of “unfilled order” slightly differently but generally it is the number of cars a shipper (such as a grain elevator) ordered but did not receive. For example, if a grain elevator ordered 10 cars from a railroad and received seven, that would leave three unfilled orders. Though railroad companies report the number of these unfilled orders to the Surface Transportation Board weekly, the dataset does not distinguish between rail cars still undelivered between weeks or new undelivered grain cars. This means grain cars that are still undelivered over one week are counted again in the following week’s report until successful delivery. So far in 2023, average weekly unfilled orders one or more days overdue have numbered over 16,000, 54%, or 5,600, more than last quarter and the same magnitude over quarter one 2022. This is the highest rate recorded since the data series began in 2017. By railroad, BNSF makes up nearly 80% of these unfilled orders (12,400) and has experienced a near 100% increase since last quarter. NS is in a distant second with an average of 1,900 unfilled weekly orders, which is down 11% from last quarter.
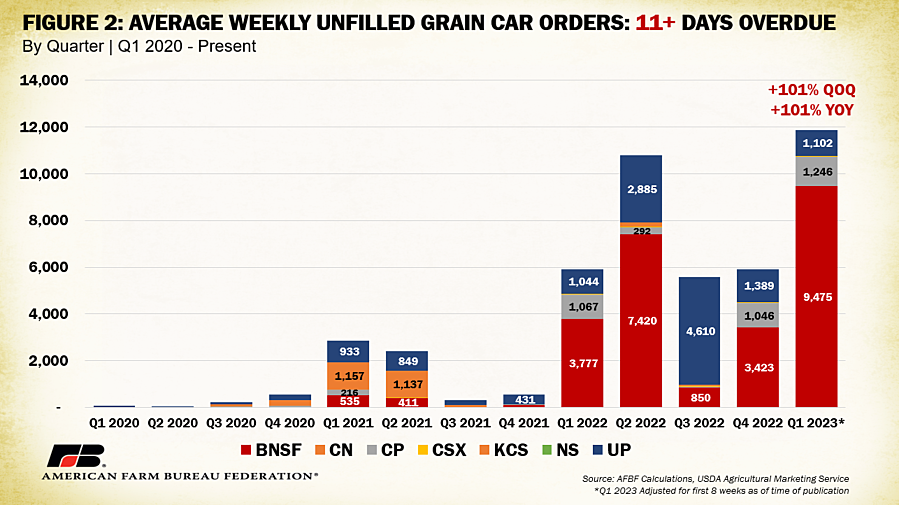
Of these over 16,000 unfilled orders per week one or more days overdue, almost 75% remain 11 or more days overdue. This is a 101% (6,000 car) increase over last quarter and the same magnitude over quarter one 2022. Comparing quarter four of last year to quarter one of 2023 so far, BNSF has seen a weekly increase of 177% (6,000) of orders 11 or more days overdue, which is also 150% higher that quarter one of last year. BNSF again makes up about 80% of the total unfilled orders. Canadian Pacific Railway is a distant second for delayed grain cars over 11 days overdue with an average of 1,246 or 10% of the total. The bulk of reported unfilled orders remain concentrated in Upper Midwest states like North Dakota (47,220 cumulative reports), Minnesota (21,500 cumulative reports in 2023) and Kansas (12,200 cumulative reports in 2023). Notably, many of these states have experienced significant snowfall within the past several months, likely contributing to challenges in getting cars moved quickly.
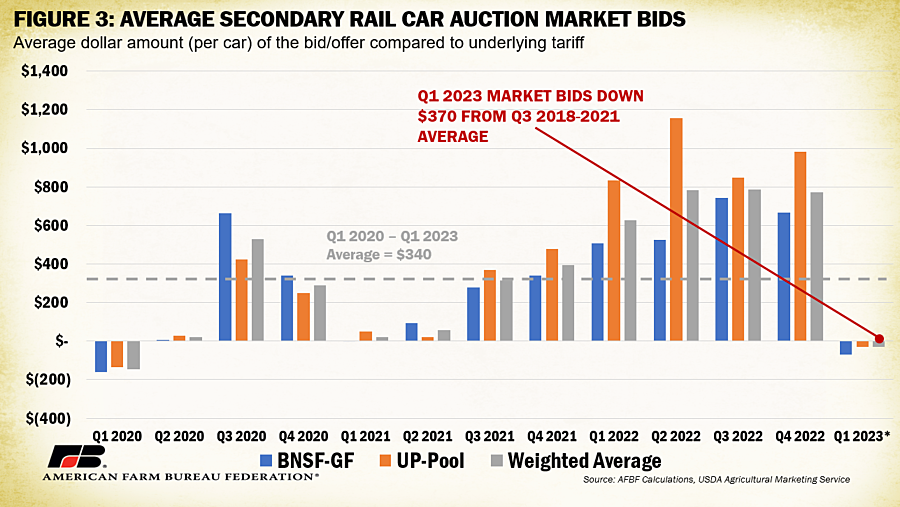
In the past we have analyzed price behavior in the secondary rail car market, which reflects the average bids shippers make against each other for contracts that could increase the chance of getting delayed product successfully moved. Sales that occur in this secondary stage may either represent a premium or a discount to the underlying original tariff rate and are reported as a positive or negative value, respectively. So far in 2023, average market bids have been below the underlying contract value (weighted average of -$30.45 per car). This is the first time since quarter one 2020 that secondary market bids have been negative and corresponds to an $800 decline from last quarter’s $770 average bid. While weekly unfilled orders have reached record levels, shippers don’t appear to be clamoring in the secondary market to access replacement capacity. Some of the bids included in these calculations are for deliveries set in future months, so lower values may signify that shippers expect railroads to increase efficiency as we head into warmer, less snow-impacted, months.
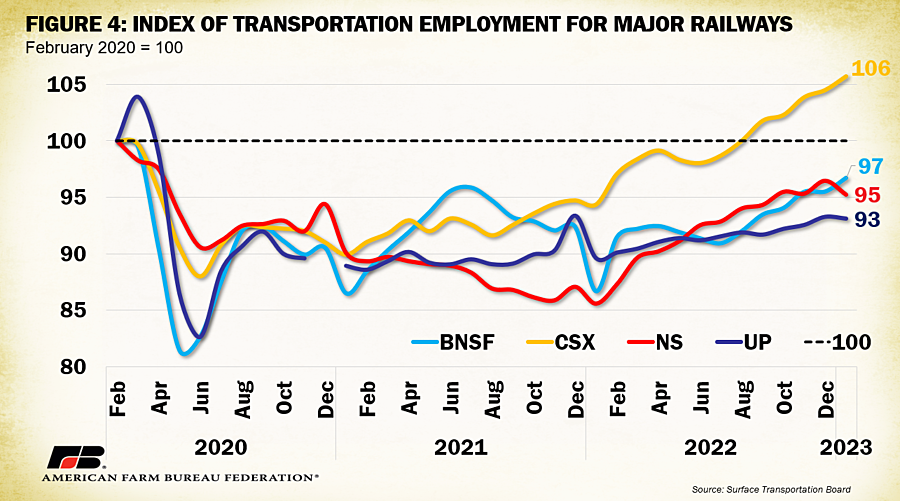
In addition to extreme winter conditions, railroads continue to cite labor as a primary hurdle to reaching pre-pandemic efficiency. Figure 4 displays the index of transportation employment for four major railroads with employment indexed to pre-pandemic levels (February 2020). A value below the 100 line would indicate a railroad that has not been able to reach pre-pandemic employment levels (100%). CSX remains the only railroad of the four to reach and surpass pre-pandemic employment levels (105% as of January 2023). BNSF has jumped from 92% to 96% of pre-pandemic employment between August 2022 and January 2023. UP has made gains but at a slower rate, hovering between 92% and 93% since August. NS, which rebounded from 85% in January 2022 to 96% in December, has since seen a 1% decline. Kansas City Southern and Canadian National Railway, which are not displayed, have surpassed or are near pre-pandemic employment. With BNSF and UP in control of 65% of grain movements, any improvements in hiring send positive signals to farmers and ranchers on the resiliency of the rail network. Any future employment declines put this reliability at risk.
Conclusion
Railways are a vital piece of the supply chain and are usually a cost-effective and reliable way to get agricultural goods to their destination. Continuing rail service disruptions associated primarily with inclement weather and labor shortages have contributed to record levels of unfilled orders faced by shippers. Unfilled and delayed orders mean a disruption in the delivery of agricultural and other goods to buyers. Confidence in railway efficiency, however, appears to be increasing. Though labor numbers still lag behind for most Class I railways, gains continue to be made, building a stronger foundation for future demand capacity. Shorter-term, cold weather events, while detrimental, will likely subside in spring and can be separated from the many pandemic-linked supply chain shocks that have characterized the last several years.
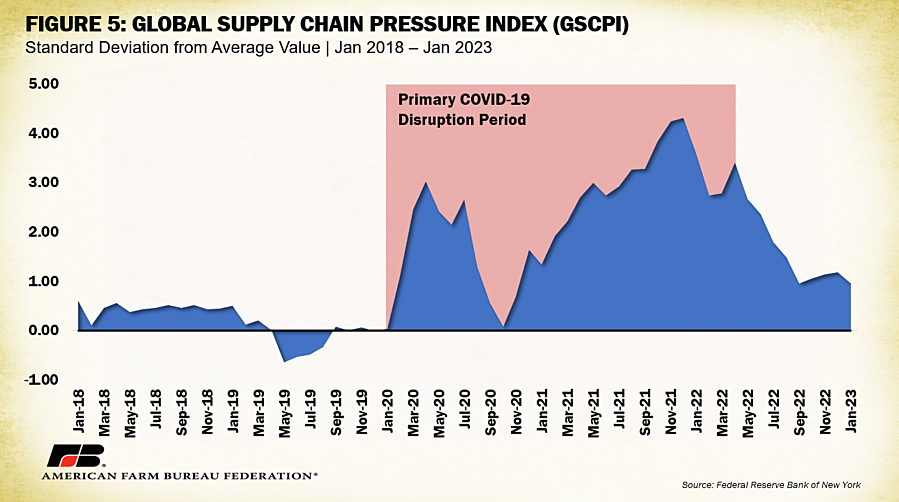
These metrics and metrics from all global transportation systems have been incorporated by the Federal Reserve Bank of New York into an index to reflect a summary of supply chain pressures, as displayed in Figure 5. Index values have moved closer to zero in the past several months, signifying reduced broader global supply chain pressure. This sends a positive signal to farmers and ranchers revving up for a new marketing year, even during a period of record unfilled rail car orders.
Top Issues
VIEW ALL