USDA Reports Bring Further June Gloom

Betty Resnick
Former AFBF Economist
On the California coast, “June Gloom” is a phenomenon where the contrast of cold ocean waters and warmer land temperatures brings weeks of grey, drizzly, cool and cloudy days, often making June the least pleasant month of the year. The June Acreage and Quarterly Grain Stocks reports, published on June 28, brought a gloomy overcast to new crop markets. This Market Intel looks at the impact of the report on corn, soybeans and cotton.
Corn
The reports had the most bearish outcomes for corn. Corn came in at 1.4 million (+1.6%) acres above the March Prospective Plantings Report at 91.5 million acres, above all trade expectations. The increase in acres from the prospective plantings report primarily came from the Western Corn Belt states, including Kansas (600,000 acres, +10.5%), Iowa (300,000 acres, +2.3%), Nebraska (250,000 acres, +2.5%) and Minnesota (200,000 acres, +2.5%). Michigan and Wisconsin had planted acreage estimates reduced by 100,000 acres each, -4.4% and -2.6%, respectively. This still represents a 3.3% decline nationally in planted acres from last year, which is reflective of falling corn prices and the high input costs of corn making it a riskier crop for profitability.
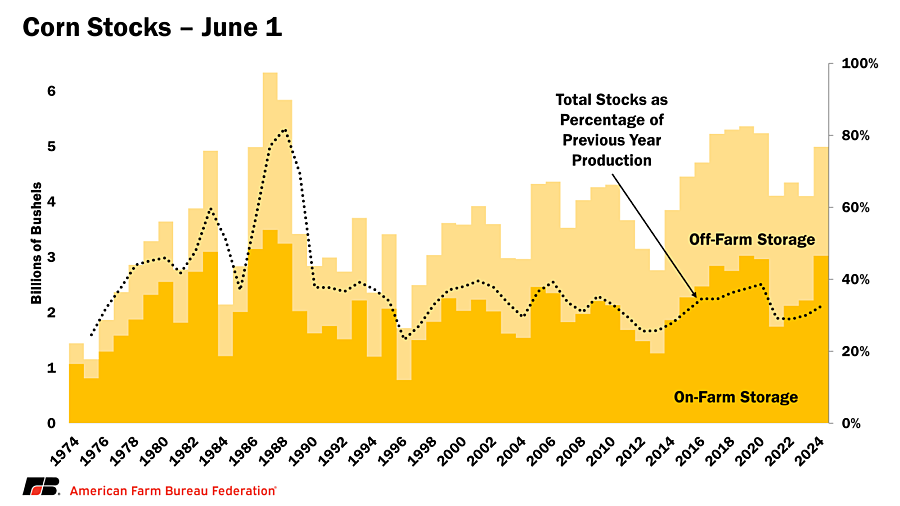
As of June 1, 2024, total corn stocks were estimated to be 4.99 billion bushels with 3.03 billion bushels stored on-farm and 1.97 stored off-farm. Total corn stocks are up 22% from June 1, 2023, above pre-report trade expectations. There are some startling statistics that can be pulled from the Grain Stocks report, including that on-farm corn stocks are at the highest level since 1988. While this does not bode well for corn prices, when put into context the numbers look less extreme. On-farm stocks are marginally higher (+0.04%, 1.1 million bushels) than at the same time in 2019, but total stocks are 370.4 million bushels (6.9%) lower over the same period.
Another way to assess the state of corn stocks is to compare stocks to the previous year’s production. As of June 1, 2024, stocks are equivalent to 32.5% of old crop production. This is an uptick from previous years, but below recent highs of 38.6% set in 2020 and well below the historic record of a whopping 81.9% set in 1988. So, while the on-farm stock total does mirror 1988, we are still in a much better position than the dreadful ‘80s.
The unexpectedly large increase in acreage coupled with the quarterly grain stocks number sent corn futures prices tumbling. While December ’24 corn futures have been continuously declining since June 20, on the day of the reports new crop futures fell 13 cents or 3.0%, closing at $4.20 per bushel. Prices held firm on July 1, but have declined a total of 9.8% over eight trading days. Throughout the month of June, December ’24 corn futures fell a total of $0.47 a bushel, an even 10%.
Soybeans
Soybean planted acres are estimated at 86.1 million acres, down 410,000 (-0.5%) acres since the March Prospective Plantings Report. The state-level changes in planted acres between the two reports were more mixed than corn, with Kansas, Illinois, Kentucky and Minnesota each gaining 100,000 acres or more, and Missouri, Iowa, Ohio, South Dakota, North Dakota and North Carolina each losing 100,000 acres or more. Year-over-year, soybean acreage nationally increased by 3.0%.
Soybean stocks as of June 1, 2024, totaled 970 million bushels. Mirroring corn, soybean stocks are up 22% year-over-year and estimates were again higher than trade expectations. With the reduction in planted acres, soybean November 2024 futures held firm on Friday, June 28 – falling only a cent to $11.04 by the close of markets. On July 1, prices rebounded, rising to $11.11. While soybean markets have been volatile since June 20, new crop prices are down $0.21 (-1.9%) between June 20 and July 1.
Cotton
On a percentage basis, cotton was the biggest surprise of the June acreage report. Total cotton planted acres are now estimated at 11.7 million acres, up 997,000 acres or 9.3% from March estimates. Texas made up the increase between reports, with estimated plantings rising by 890,000 acres (16.1%), followed by Arkansas with 130,000 additional acres (24.1%). Upland cotton accounted for all report-over-report acreage increases, with Pima cotton falling by 21,000 acres to 182,000 acres – still a 24% increase over 2023. Year-over-year, total cotton acreage is up 1.44 million acres (14.1%).
Cotton #2 December futures prices dipped slightly in response to the news, falling 196 points to 72.69 cents per pound on June 28. In the eight trading days between June 20 and July 1, cotton prices rose from 72.82 cents per pound to 73.10 cents per pound.
Principal Crops
USDA’s definition of principal crops includes 22 crops ranging from corn to potatoes to proso millet. One of the largest surprises in the March Prospective Plantings Report was a drop of 6.3 million acres (-2.0%) in principal crops acres, which were down to 313.3 million acres.
The June Acreage report finds principal crops at 315.2 million acres, a recovery compared to March estimates but still a 4.4 million acre (-1.3%) decrease from 2023. Corn and cotton made up the majority of these increased acres, with Texas (814,000 acres) and Kansas (672,000 acres) having the largest increases by state compared to the March report. While 11 states had increases of over 100,000 acres, Missouri, Oklahoma, South Dakota and Colorado all saw reductions in estimated acreage of over 100,000.
Looking Forward
Now that planted acre estimates are set, the markets will continue to focus on weather impacts this summer. It is notable that historic and tragic flooding at the intersection of Iowa, Minnesota, and South Dakota will impact acres harvested. Floods began after surveys for the June Acreage reports were completed in mid-June and after planting was wrapped up for corn and soybeans in these states, so was not factored into the June Planted Acreage report.
The next major row crop report will come out on July 12 with the July 2024 World Agricultural Supply and Demand Estimates (WASDE) Report. The July reports could be the first attempt by the USDA to estimate the damage caused by flooding in the Western Corn Belt.
Top Issues
VIEW ALL